Sound Sources, Vibrations & Receivers — Print · Grade 8 Science
Chapter: Waves, Sound & LightSound Sources, Vibrations & Receivers
Learning goals
- I can read source vibration records and distinguish amplitude, frequency and pitch.
- I can explain energy transfer from a source through matter to a receiver and qualify a loudness prediction.
Readings for this unit
Before this unit
Review the earlier force and energy-transfer ideas. The visible language notes explain this unit’s quantities; then connect them to its concrete records and figure.
Use three teaching sessions of about 40–45 minutes: first observe the phenomenon, draft a model and study Parts 1–2; next explain Parts 3–4 with the figures and evidence; then work the application, examples, practice, model revision and exit check. Divide any difficult part into smaller steps and revisit after feedback. Investigations, review and quizzes have separate sessions. Study the four visual parts across the scheduled sessions, then use the illustrated worked case and independent transfer questions. Extend or revisit a session when the learner cannot explain the figure; completion time is a proposed allocation, not a mastery guarantee.
Start with something to explain
What would explain the observations in sound sources, vibrations & receivers?
Illustrative evidence case. Illustrative sources A/B/C have amplitudes 1/3/1 mm and complete 4/4/6 cycles respectively in 0.02 s.
Notice and wonder
Which source has the highest modeled pitch and which the largest amplitude? Write two observations from the supplied record without guessing their cause. Include a quantity and its unit when given. An observation is what was recorded; an inference is what you think explains it.
Write one question about why the pattern occurs and one question about a comparison that could distinguish competing explanations. A testable question identifies what could be observed or measured.
Your first model
Before reading the model answer, sketch the named objects or particles and label what you think changes. Compare frequency and amplitude and explain what a receiver prediction would need. Keep this first version so you can compare it with your later explanation.
Build the language from the idea
- vibration
- Repeated motion around a rest position.
- source
- Object initiating the sound disturbance.
- receiver
- Object or system responding to the arriving disturbance.
- amplitude
- Largest displacement from rest in the simple oscillation model.
- frequency
- Complete cycles per second, measured in hertz.
- model
- A representation that explains selected features and makes predictions; it leaves other details out.
- evidence
- Relevant observations or records used to support or challenge a claim.
- system boundary
- The chosen limit separating the objects being studied from their surroundings.
- assumption
- A condition taken as true for a model or calculation and needing to be checked against the case.
A ruler projecting from a table can make a sound when gently displaced and released; its tip moves back and forth. A vibration is repeated motion about a rest position.
A source is the vibrating object producing the disturbance, and a receiver is the object that responds elsewhere. Between them, sound ordinarily needs matter such as air.
Energy is transferred through the system; the ruler itself does not travel to an ear. Use quiet sounds or supplied data, and never increase volume to make a dramatic shaking effect.
Students who cannot hear a sound can study its visible motion and supplied vibration records.
An observation is what a person or instrument records. An inference is a proposed interpretation of those records. Keep the two separate: a graph can show a pattern while more than one mechanism might explain it. State the chosen system, or part of the world being studied, and its boundary before accounting for material or energy transfers.
Use each figure as a reasoning tool. Read its caption and labels, describe the pattern, then explain a cause. If the picture is schematic, use the stated numbers rather than measuring its printed size. Check whether its simplified conditions match the problem before applying a formula.
Build your understanding
Where this fits
This unit helps answer the chapter question: How do waves and circuits transfer energy and information? Keep a notebook table with the question, evidence, explanation and one unresolved issue. Revise a previous model only when you can name the new evidence or idea that changes it.
Use three teaching sessions of about 40–45 minutes: first observe the phenomenon, draft a model and study Parts 1–2; next explain Parts 3–4 with the figures and evidence; then work the application, examples, practice, model revision and exit check. Divide any difficult part into smaller steps and revisit after feedback. Investigations, review and quizzes have separate sessions.
Part 1 · Locate what moves at the source
A sound source may vibrate too quickly or through too small a distance for normal viewing. Visible slow-motion records or graphs can provide evidence. A source can move back and forth while its average location remains approximately the same. Rest position means the location around which it vibrates.
Read the visual model
Does no visible motion prove that a source is not vibrating?
Visual reasoning — after your attempt
No. The motion can be too fast or small to detect with the chosen method. A suitable measurement or record is needed.
A clean flexible ruler can be held gently against a table and plucked at low amplitude, away from faces. The protruding tip moves alternately above and below rest. Stop if the material is brittle; the supplied records are an equal alternative.
Pause and explain
Does no visible motion prove that a source is not vibrating?
Check your reasoning after answering
No. The motion can be too fast or small to detect with the chosen method. A suitable measurement or record is needed.
Part 2 · Compare amplitude without changing frequency silently
Amplitude is the greatest displacement from the rest position in the simple vibration model. Larger amplitude often corresponds to louder sound under comparable conditions. Loudness is a perception, not identical to a directly measured amplitude. The medium, distance and receiver also matter.
Read the visual model
A cycle is one complete repeat, such as one peak to the next matching peak. A taller trace does not automatically have more cycles. Compare amplitude and frequency one at a time rather than using the word louder for both.
Which record has a higher frequency? What quantity differs, and what additional labels are needed for a numerical amplitude?
Visual reasoning — after your attempt
Neither has a higher frequency in this matched window. Displacement amplitude differs; a numerical vertical position scale and units are needed to measure it.
Illustrative source A moves between +1 and −1 mm, while B moves between +3 and −3 mm. Both complete four cycles in 0.02 s. B has three times the displacement amplitude, but not three times the frequency.
Pause and explain
What is B’s amplitude and what quantity remains unchanged?
Check your reasoning after answering
Amplitude is 3 mm. The cycle count per time, and hence frequency of 200 Hz, is unchanged in this comparison.
Part 3 · Count complete cycles to explain pitch
Frequency is the number of complete cycles per second, measured in hertz, written Hz. A higher-frequency sound is generally perceived as higher pitch. Count a cycle from one repeated phase to the next, such as an upward rest crossing to the next upward crossing.
Read the visual model
Hertz (Hz) means cycles per second. Period is seconds per cycle. These are reciprocal descriptions of one repeat rate, while amplitude measures the size of the local displacement.
If the same source completed four cycles in this one-second window at the same peak displacement, which quantities would change?
Visual reasoning — after your attempt
Frequency would become 4 Hz and period 0.25 s. Amplitude would remain 2 mm; changing cycle rate need not change the displacement amplitude.
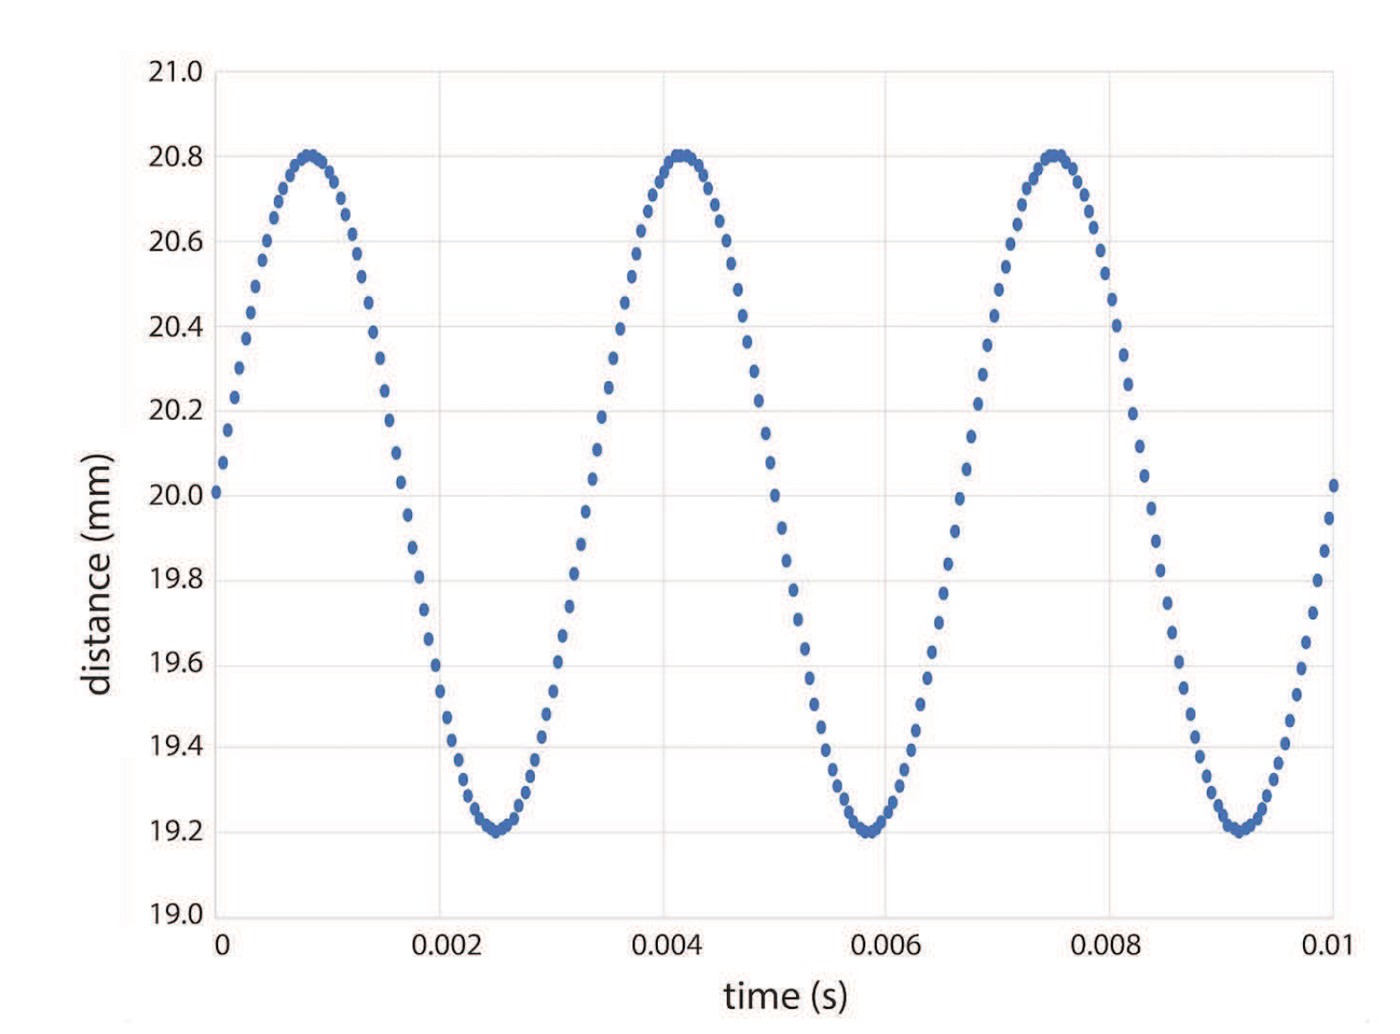
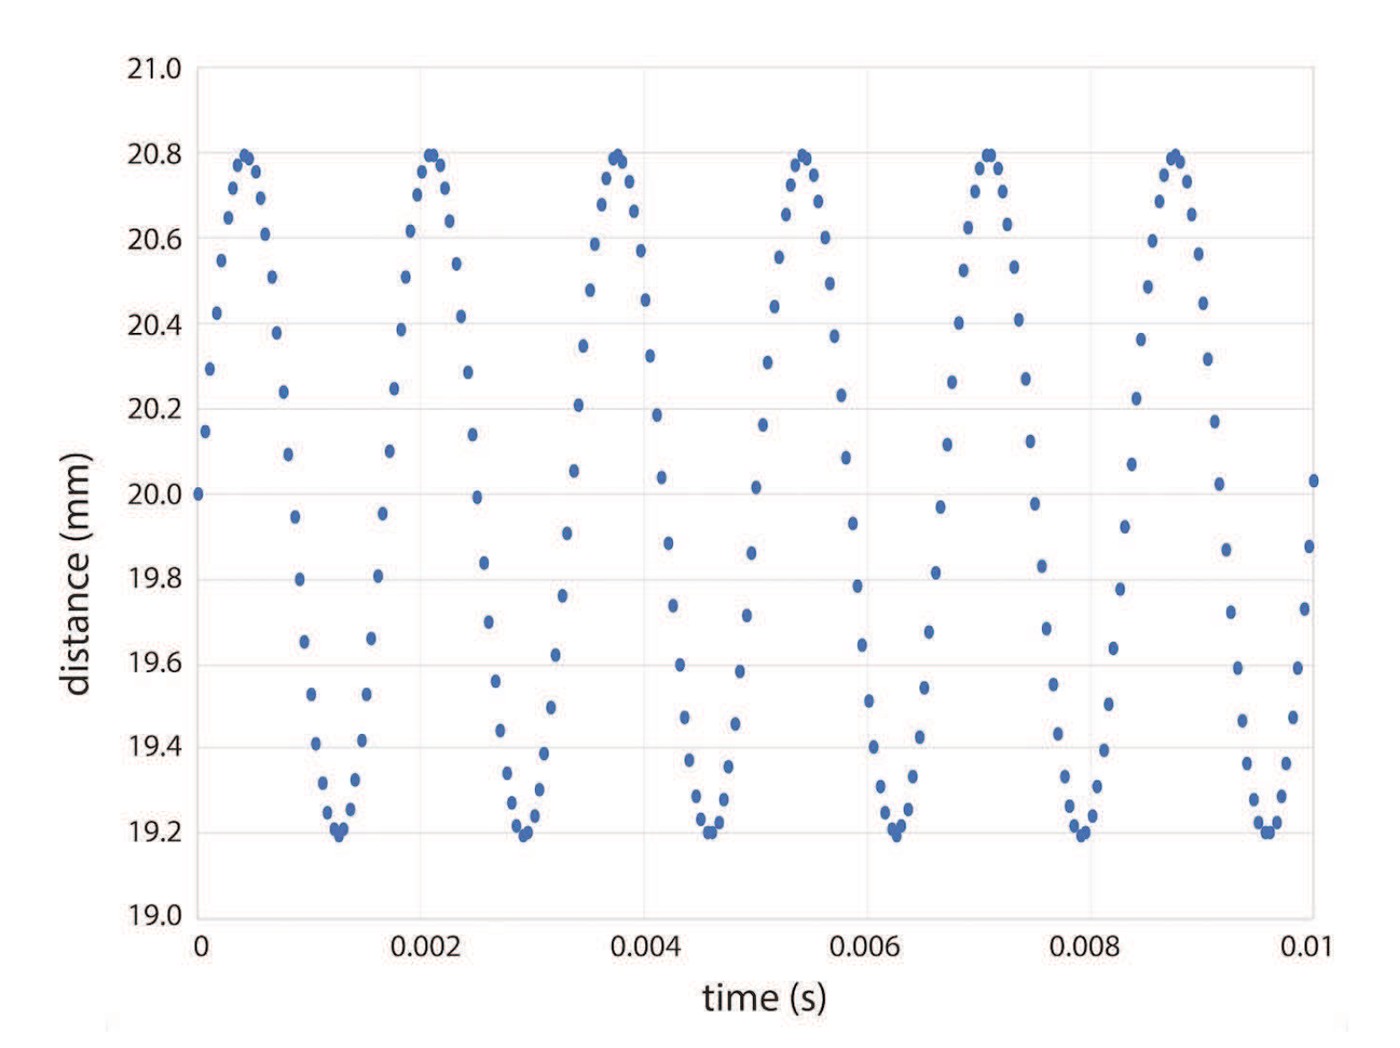
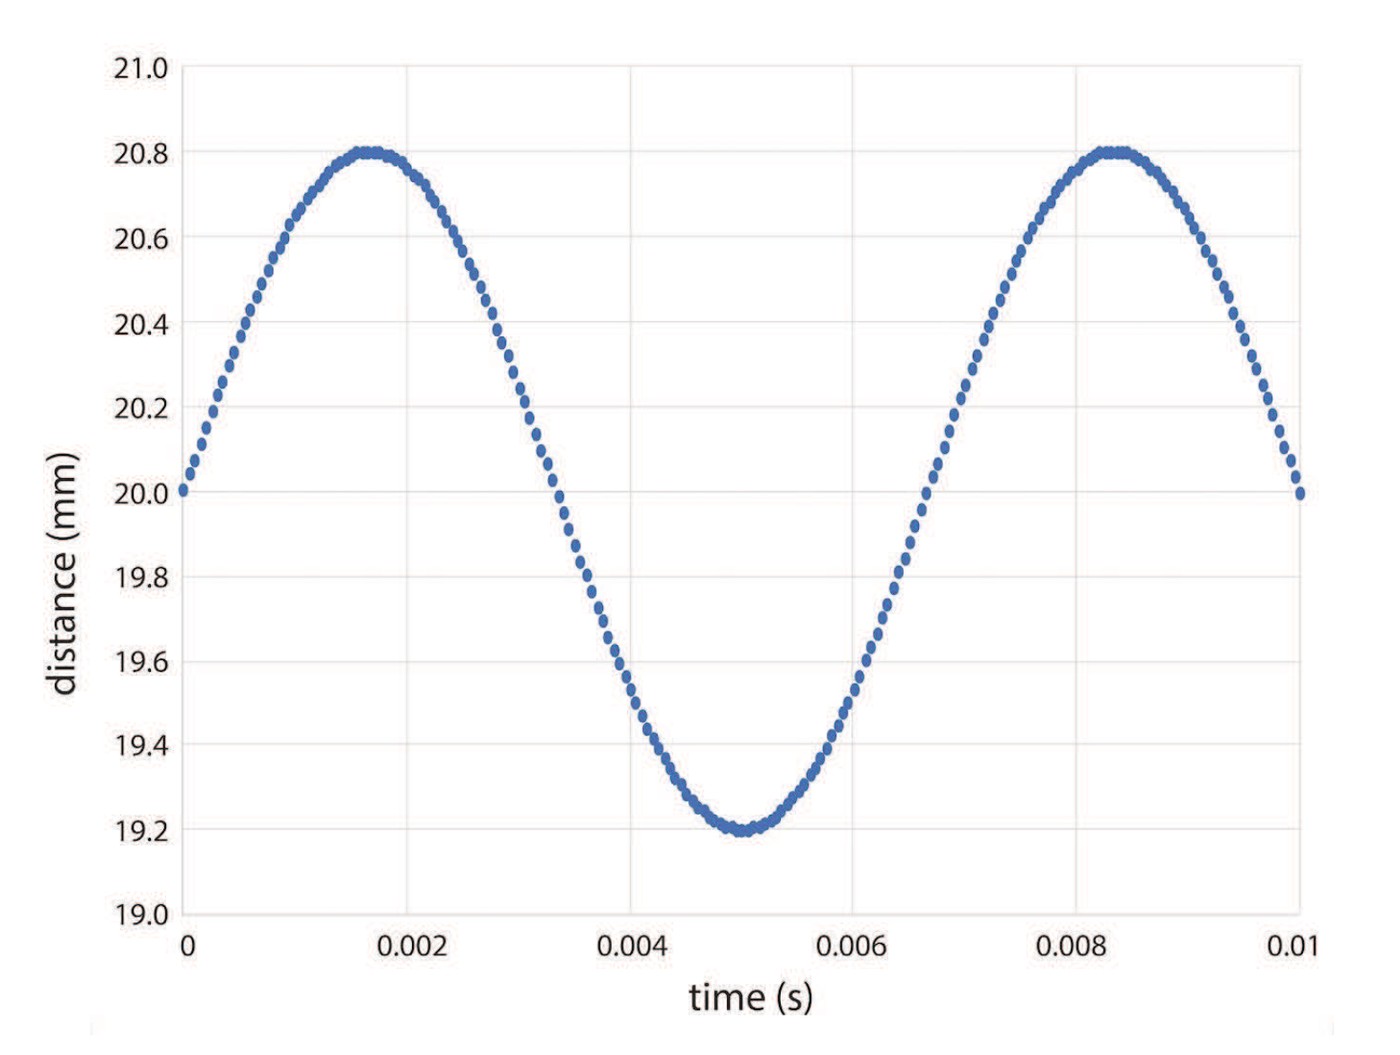
A supplied graph with six complete cycles in 0.02 s gives 300 Hz; four cycles in the same interval gives 200 Hz. Equal vertical height does not imply equal pitch. Read both axes before comparing graphs.
Pause and explain
Why is counting only crests without an interval insufficient?
Check your reasoning after answering
Frequency needs the number of complete cycles divided by a defined time. An unscaled drawing alone does not establish hertz.
Part 4 · Connect source, medium and receiver
The vibrating source exerts forces on adjacent matter. Successive interactions transfer the disturbance through the medium, and a receiver can vibrate in response. Air particles mainly oscillate locally rather than travel all the way from source to receiver. A hearing system receives mechanical input and converts it into signals to the brain.
Read the visual model
A medium is the material through which a mechanical wave travels. A receiver can be an ear, a window or a sensor. Describe what changes at each stage and distinguish matter movement from the disturbance’s travel.
What is wrong with saying a piece of the vibrating ruler travels through the air into the listener’s ear?
Visual reasoning — after your attempt
The ruler stays near its source position. A disturbance and energy pass through interactions in the medium; local particle motion does not require transport of ruler material to the receiver.
A simplified chain is ruler → nearby air → farther air → receiver. A paper membrane can be a model receiver, but detectable motion depends on many factors. Failure to see it move at quiet volume is not evidence that energy transfer never occurs.
Pause and explain
What is missing from a drawing with only a source and an ear?
Check your reasoning after answering
The intermediate medium and interactions, and how the receiver responds. The picture should also identify limits such as scale and omitted biological detail.
Apply the whole unit · Three source records
Illustrative case for analysis, not measurements collected by the learner. Illustrative sources A/B/C have amplitudes 1/3/1 mm and complete 4/4/6 cycles respectively in 0.02 s.
Your task
Compare frequency and amplitude and explain what a receiver prediction would need. Use the supplied conditions, show intermediate reasoning and distinguish the supported conclusion from a broader claim.
What your response should show
- Use the specified quantities and units.
- Explain an intermediate step or comparison.
- Connect the pattern to the physical mechanism.
- State an assumption or limitation.
Response guidance — after your attempt
Divide complete cycles by the common time window: A and B give 4/0.02=200 Hz.
C gives 6/0.02=300 Hz, so C has higher frequency while sharing A’s 1 mm amplitude.
Compare B/A amplitude: 3/1=3, without a changed frequency between those two sources.
For a receiver prediction, also specify distance, medium, losses and response; source amplitude does not fix exact perceived loudness.
A and B are 200 Hz, while C is 300 Hz. B has three times A’s amplitude; C has A’s amplitude but higher frequency. Frequency and amplitude are distinct. Predicting received sound also needs distance, medium, losses and receiver response. The source records alone do not establish an exact perceived loudness.
Scientific references and adapted teaching resources
- OpenSciEd 8.2 Sound Waves — public unit overview
- OpenSciEd 8.3 Forces at a Distance — public unit overview
- OpenSciEd instructional model — storyline routines
- Creative Commons Attribution 4.0 — middle-school material license
- OpenSciEd 8.2 Lesson 5 — Analyzing Graphs of Sound Source Vibrations (public handout)
Parent / teacher teaching notes
Ask the learner to describe the phenomenon before naming a formula. Discuss each checkpoint after an attempt. Use the supplied records when equipment is unavailable and label them illustrative rather than actual measurements. The final explanation should identify a mechanism and a limit, with different defensible wording accepted. Adaptation credit: OpenSciEd middle-school teaching routines and public task structures by OpenSciEd, CC BY 4.0. This independent version adds original explanatory text, data and figures, terminology support and a home-study schedule. It does not reproduce the complete teacher editions or their classroom validation.
The key idea
Amplitude and frequency can vary independently. Compare graph height and cycles per stated time separately. A and B are 200 Hz, while C is 300 Hz.
Worked examples
Example 1 · Build the first reasoning step
- Identify what the question asks and what the stated observation establishes.
- No. The motion can be too fast or small to detect with the chosen method. A suitable measurement or record is needed.
Example 2 · Three source records
- Divide complete cycles by the common time window: A and B give 4/0.02=200 Hz.
- C gives 6/0.02=300 Hz, so C has higher frequency while sharing A’s 1 mm amplitude.
- Compare B/A amplitude: 3/1=3, without a changed frequency between those two sources.
- For a receiver prediction, also specify distance, medium, losses and response; source amplitude does not fix exact perceived loudness.
Explain why each stated condition matters.
Example 3 · Transfer to a different condition
- Identify the changed condition.
- Pitch is associated with the shared frequency, while loudness may differ with amplitude under comparable source, medium, distance and receiver conditions. Neither quantity is a universal perception guarantee.
Example 4 · Find and fix the mistake
- Distinguish what is observed from what is inferred.
- Amplitude and frequency can vary independently. Compare graph height and cycles per stated time separately.
Compare the claim with the stated observations and model assumptions.
Example 5 · Interpret the visual model
- Identify the represented objects, axes, labeled quantities and stated conditions before choosing a rule.
- A cycle is one complete repeat, such as one peak to the next matching peak. A taller trace does not automatically have more cycles. Compare amplitude and frequency one at a time rather than using the word louder for both.
- Neither has a higher frequency in this matched window. Displacement amplitude differs; a numerical vertical position scale and units are needed to measure it.
Keep the model’s stated limits explicit: Both source-position records show two cycles during the same stated time window, with different displacement amplitudes. Amplitude is measured from the middle position to a peak, not from peak to trough. The sketches compare patterns qualitatively; an actual amplitude and frequency require numerical axis scales, as in the OpenSciEd graphs used below.
Avoid these mistakes
- Amplitude and frequency can vary independently. Compare graph height and cycles per stated time separately.
- Do not treat a schematic drawing as a scale measurement or a universal guarantee.
- Keep the stated comparison conditions and measurement boundary explicit.
- A correct numerical result needs units and an explanation of its meaning.
Check your understanding
Does no visible motion prove that a source is not vibrating?
Discuss the answer
No. The motion can be too fast or small to detect with the chosen method. A suitable measurement or record is needed.
What is B’s amplitude and what quantity remains unchanged?
Discuss the answer
Amplitude is 3 mm. The cycle count per time, and hence frequency of 200 Hz, is unchanged in this comparison.
Why is counting only crests without an interval insufficient?
Discuss the answer
Frequency needs the number of complete cycles divided by a defined time. An unscaled drawing alone does not establish hertz.
What is missing from a drawing with only a source and an ear?
Discuss the answer
The intermediate medium and interactions, and how the receiver responds. The picture should also identify limits such as scale and omitted biological detail.
Return to the phenomenon
Illustrative sources A/B/C have amplitudes 1/3/1 mm and complete 4/4/6 cycles respectively in 0.02 s. Compare frequency and amplitude and explain what a receiver prediction would need. Revise your first explanation using a named idea from the lesson. Mark the changed part and the evidence that supports it.
Compare explanations after your attempt
A and B are 200 Hz, while C is 300 Hz. B has three times A’s amplitude; C has A’s amplitude but higher frequency. Frequency and amplitude are distinct. Predicting received sound also needs distance, medium, losses and receiver response. The source records alone do not establish an exact perceived loudness.
What should we investigate next?
Which condition could be changed to test a remaining uncertainty in this explanation? State the predicted observation and what result would challenge your model.
Investigate, explain and revise
Use these tasks after the three teaching sessions as needed. Discuss an attempted explanation before opening response guidance; a matching sentence is less important than a supported mechanism.
Activity 1 · Explain the new evidence case
Use the visible scenario above, Parts 1–4 and your first notebook model. No outside reading or equipment is required.
Your task
Illustrative sources A/B/C have amplitudes 1/3/1 mm and complete 4/4/6 cycles respectively in 0.02 s. Compare frequency and amplitude and explain what a receiver prediction would need. Write 100–150 words or give a labeled drawing with an equivalent oral explanation.
Success criteria
- Use two relevant stated records or conditions.
- Explain the mechanism rather than only repeat a definition.
- Label observation and inference.
- Name a changed model feature or a remaining uncertainty.
Hint
Read the stated boundary and conditions before selecting a relationship. The unit’s worked examples show intermediate steps.
Response guidance — discuss after your attempt
A and B are 200 Hz, while C is 300 Hz. B has three times A’s amplitude; C has A’s amplitude but higher frequency. Frequency and amplitude are distinct. Predicting received sound also needs distance, medium, losses and receiver response. The source records alone do not establish an exact perceived loudness.
Activity 2 · Read and extend the figure
Study the new labeled figure and its caption, then compare it with the associated teaching part.
Your task
Which source has the highest modeled pitch and which the largest amplitude? Explain what each important label represents. Add one missing feature that would be needed for a different question, and explain why the original figure leaves it out.
Success criteria
- Answer the figure question with its stated labels.
- Connect the visual representation to the scientific idea.
- Identify a specific limitation from the caption.
- Propose a useful change without misrepresenting supplied evidence.
Hint
Each row spans the same 0.02-second time interval with a common displacement scale, centered on its own rest line. A and B have four cycles and therefore 200 Hz; C has six and therefore 300 Hz. B has larger amplitude than A without higher frequency. These are original illustrative traces, not copied measurements.
Response guidance — discuss after your attempt
C has the highest frequency, 300 Hz; B has the largest displacement amplitude, 3 mm. The two properties are independent in this comparison. Each row spans the same 0.02-second time interval with a common displacement scale, centered on its own rest line. A and B have four cycles and therefore 200 Hz; C has six and therefore 300 Hz. B has larger amplitude than A without higher frequency. These are original illustrative traces, not copied measurements.
Words to know
- vibration
- Repeated motion around a rest position.
- source
- Object initiating the sound disturbance.
- receiver
- Object or system responding to the arriving disturbance.
- amplitude
- Largest displacement from rest in the simple oscillation model.
- frequency
- Complete cycles per second, measured in hertz.
- model
- A representation that explains selected features and makes predictions; it leaves other details out.
- evidence
- Relevant observations or records used to support or challenge a claim.
- system boundary
- The chosen limit separating the objects being studied from their surroundings.
- assumption
- A condition taken as true for a model or calculation and needing to be checked against the case.
In the real world
Illustrative sources A/B/C have amplitudes 1/3/1 mm and complete 4/4/6 cycles respectively in 0.02 s.
Exit check
Which source has the highest modeled pitch and which the largest amplitude? Explain the relevant mechanism and one model limitation.
Check your explanation after answering
C has the highest frequency, 300 Hz; B has the largest displacement amplitude, 3 mm. The two properties are independent in this comparison. Each row spans the same 0.02-second time interval with a common displacement scale, centered on its own rest line. A and B have four cycles and therefore 200 Hz; C has six and therefore 300 Hz. B has larger amplitude than A without higher frequency. These are original illustrative traces, not copied measurements.
Explain your reasoning without notes. If a key idea is missing, revisit the lesson and try again.
Problem 1
Answer and explanation
No. The motion can be too fast or small to detect with the chosen method. A suitable measurement or record is needed.
No. The motion can be too fast or small to detect with the chosen method. A suitable measurement or record is needed.
Response criteria
- Use the supplied conditions and relevant evidence.
- Explain the scientific mechanism or calculation.
- State a meaningful limitation or testable next step.
Problem 2
Answer and explanation
Amplitude is 3 mm. The cycle count per time, and hence frequency of 200 Hz, is unchanged in this comparison.
Amplitude is 3 mm. The cycle count per time, and hence frequency of 200 Hz, is unchanged in this comparison.
Response criteria
- Use the supplied conditions and relevant evidence.
- Explain the scientific mechanism or calculation.
- State a meaningful limitation or testable next step.
Problem 3
Answer and explanation
Frequency needs the number of complete cycles divided by a defined time. An unscaled drawing alone does not establish hertz.
Frequency needs the number of complete cycles divided by a defined time. An unscaled drawing alone does not establish hertz.
Response criteria
- Use the supplied conditions and relevant evidence.
- Explain the scientific mechanism or calculation.
- State a meaningful limitation or testable next step.
Problem 4
Answer and explanation
The intermediate medium and interactions, and how the receiver responds. The picture should also identify limits such as scale and omitted biological detail.
The intermediate medium and interactions, and how the receiver responds. The picture should also identify limits such as scale and omitted biological detail.
Response criteria
- Use the supplied conditions and relevant evidence.
- Explain the scientific mechanism or calculation.
- State a meaningful limitation or testable next step.
Problem 5
Answer and explanation
A and B are 200 Hz, while C is 300 Hz. B has three times A’s amplitude; C has A’s amplitude but higher frequency. Frequency and amplitude are distinct. Predicting received sound also needs distance, medium, losses and receiver response. The source records alone do not establish an exact perceived loudness.
A and B are 200 Hz, while C is 300 Hz. B has three times A’s amplitude; C has A’s amplitude but higher frequency. Frequency and amplitude are distinct. Predicting received sound also needs distance, medium, losses and receiver response. The source records alone do not establish an exact perceived loudness.
Response criteria
- Use the supplied conditions and relevant evidence.
- Explain the scientific mechanism or calculation.
- State a meaningful limitation or testable next step.
Problem 6
Answer and explanation
Pitch is associated with the shared frequency, while loudness may differ with amplitude under comparable source, medium, distance and receiver conditions. Neither quantity is a universal perception guarantee.
Pitch is associated with the shared frequency, while loudness may differ with amplitude under comparable source, medium, distance and receiver conditions. Neither quantity is a universal perception guarantee.
Response criteria
- Use the supplied conditions and relevant evidence.
- Explain the scientific mechanism or calculation.
- State a meaningful limitation or testable next step.
Problem 7
Answer and explanation
Amplitude and frequency can vary independently. Compare graph height and cycles per stated time separately.
Amplitude and frequency can vary independently. Compare graph height and cycles per stated time separately.
Response criteria
- Use the supplied conditions and relevant evidence.
- Explain the scientific mechanism or calculation.
- State a meaningful limitation or testable next step.
Problem 8
Answer and explanation
A simplified chain is ruler → nearby air → farther air → receiver. A paper membrane can be a model receiver, but detectable motion depends on many factors. Failure to see it move at quiet volume is not evidence that energy transfer never occurs. The intermediate medium and interactions, and how the receiver responds. The picture should also identify limits such as scale and omitted biological detail.
A simplified chain is ruler → nearby air → farther air → receiver. A paper membrane can be a model receiver, but detectable motion depends on many factors. Failure to see it move at quiet volume is not evidence that energy transfer never occurs. The intermediate medium and interactions, and how the receiver responds. The picture should also identify limits such as scale and omitted biological detail.
Response criteria
- Use the supplied conditions and relevant evidence.
- Explain the scientific mechanism or calculation.
- State a meaningful limitation or testable next step.
Problem 9
Hints
Distinguish the observed quantities, the proposed mechanism and its conditions.
Answer and explanation
Both have frequency 200 Hz; amplitude doubles. Frequency-related pitch is comparable in the simple model, while received loudness also depends on distance, medium and receiver. The amplitude comparison alone does not fix a person’s perception.
Both have frequency 200 Hz; amplitude doubles. Frequency-related pitch is comparable in the simple model, while received loudness also depends on distance, medium and receiver. The amplitude comparison alone does not fix a person’s perception.
Problem 10
Hints
Distinguish the observed quantities, the proposed mechanism and its conditions.
Answer and explanation
Pitch is associated with the shared frequency, while loudness may differ with amplitude under comparable source, medium, distance and receiver conditions. Neither quantity is a universal perception guarantee.
Pitch is associated with the shared frequency, while loudness may differ with amplitude under comparable source, medium, distance and receiver conditions. Neither quantity is a universal perception guarantee.
Problem 11
Answer and explanation
Neither has a higher frequency in this matched window. Displacement amplitude differs; a numerical vertical position scale and units are needed to measure it.
A cycle is one complete repeat, such as one peak to the next matching peak. A taller trace does not automatically have more cycles. Compare amplitude and frequency one at a time rather than using the word louder for both.
Neither has a higher frequency in this matched window. Displacement amplitude differs; a numerical vertical position scale and units are needed to measure it.
Response criteria
- Use the named labels, directions or supplied quantities accurately.
- Connect the visual evidence to the scientific mechanism or calculation.
- State the relevant model conditions or limitation.
Problem 12
Answer and explanation
Period 0.2 s; frequency 5 Hz; amplitude 3 mm; peak-to-trough span 6 mm. The source moves locally rather than traveling across the sound path.
Use matching-peak separation for period and its reciprocal for frequency.
Measure amplitude from the middle position to a peak.
Period 0.2 s; frequency 5 Hz; amplitude 3 mm; peak-to-trough span 6 mm. The source moves locally rather than traveling across the sound path.
Response criteria
- Use the named labels, directions or supplied quantities accurately.
- Connect the visual evidence to the scientific mechanism or calculation.
- State the relevant model conditions or limitation.
Problem 13
Answer and explanation
One cycle takes about 0.0033 s, giving frequency about 300 Hz using cycles per second = 1/period. The midline is near 20 mm and extrema are about 19.2 and 20.8 mm, so displacement amplitude is about 0.8 mm. Amplitude measures departure from the midline, not distance from the coordinate origin. Allow reasonable approximate readings from this source graph.
Compare consecutive peaks: about 0.0033 s per cycle.
Compute 1/period, approximately 300 cycles per second, or Hz.
Amplitude is about 20.8−20 = 0.8 mm (half the peak-to-peak displacement).
Response criteria
- Read time on the horizontal axis; do not call it wavelength.
- Estimate frequency from repeats per second.
- Measure amplitude from the midline and distinguish coordinate origin from equilibrium.
Problem 14
Answer and explanation
One cycle takes about 0.0017 s, giving frequency about 600 Hz using cycles per second = 1/period. The midline is near 20 mm and extrema are about 19.2 and 20.8 mm, so displacement amplitude is about 0.8 mm. Amplitude measures departure from the midline, not distance from the coordinate origin. Allow reasonable approximate readings from this source graph. B has about twice A’s frequency and half its period, while displacement amplitude stays approximately 0.8 mm. Faster repetition does not automatically mean a larger vibration.
Compare consecutive peaks: about 0.0017 s per cycle.
Compute 1/period, approximately 600 cycles per second, or Hz.
Amplitude is about 20.8−20 = 0.8 mm (half the peak-to-peak displacement).
Response criteria
- Read time on the horizontal axis; do not call it wavelength.
- Estimate frequency from repeats per second.
- Measure amplitude from the midline and distinguish coordinate origin from equilibrium.
Problem 15
Answer and explanation
One cycle takes about 0.0067 s, giving frequency about 150 Hz using cycles per second = 1/period. The midline is near 20 mm and extrema are about 19.2 and 20.8 mm, so displacement amplitude is about 0.8 mm. Amplitude measures departure from the midline, not distance from the coordinate origin. Allow reasonable approximate readings from this source graph. About 1.5 cycles in 0.010 s gives 150 Hz. Counting only one ignores the half-cycle and would incorrectly give 100 Hz; use the measured period or account for the partial cycle.
Compare consecutive peaks: about 0.0067 s per cycle.
Compute 1/period, approximately 150 cycles per second, or Hz.
Amplitude is about 20.8−20 = 0.8 mm (half the peak-to-peak displacement).
Response criteria
- Read time on the horizontal axis; do not call it wavelength.
- Estimate frequency from repeats per second.
- Measure amplitude from the midline and distinguish coordinate origin from equilibrium.