Sound Sources, Vibrations & Receivers — Practice · Grade 8 Science
Chapter: Waves, Sound & LightWhat this practice covers
By the end of Sound Sources, Vibrations & Receivers you should be able to:
- I can read source vibration records and distinguish amplitude, frequency and pitch.
- I can explain energy transfer from a source through matter to a receiver and qualify a loudness prediction.
15 questions, written answer, each with a worked explanation.
Vocabulary used: vibration, source, receiver, amplitude, frequency, model, evidence, system boundary, assumption.
Problem 1
Answer and explanation
No. The motion can be too fast or small to detect with the chosen method. A suitable measurement or record is needed.
No. The motion can be too fast or small to detect with the chosen method. A suitable measurement or record is needed.
Response criteria
- Use the supplied conditions and relevant evidence.
- Explain the scientific mechanism or calculation.
- State a meaningful limitation or testable next step.
Problem 2
Answer and explanation
Amplitude is 3 mm. The cycle count per time, and hence frequency of 200 Hz, is unchanged in this comparison.
Amplitude is 3 mm. The cycle count per time, and hence frequency of 200 Hz, is unchanged in this comparison.
Response criteria
- Use the supplied conditions and relevant evidence.
- Explain the scientific mechanism or calculation.
- State a meaningful limitation or testable next step.
Problem 3
Answer and explanation
Frequency needs the number of complete cycles divided by a defined time. An unscaled drawing alone does not establish hertz.
Frequency needs the number of complete cycles divided by a defined time. An unscaled drawing alone does not establish hertz.
Response criteria
- Use the supplied conditions and relevant evidence.
- Explain the scientific mechanism or calculation.
- State a meaningful limitation or testable next step.
Problem 4
Answer and explanation
The intermediate medium and interactions, and how the receiver responds. The picture should also identify limits such as scale and omitted biological detail.
The intermediate medium and interactions, and how the receiver responds. The picture should also identify limits such as scale and omitted biological detail.
Response criteria
- Use the supplied conditions and relevant evidence.
- Explain the scientific mechanism or calculation.
- State a meaningful limitation or testable next step.
Problem 5
Answer and explanation
A and B are 200 Hz, while C is 300 Hz. B has three times A’s amplitude; C has A’s amplitude but higher frequency. Frequency and amplitude are distinct. Predicting received sound also needs distance, medium, losses and receiver response. The source records alone do not establish an exact perceived loudness.
A and B are 200 Hz, while C is 300 Hz. B has three times A’s amplitude; C has A’s amplitude but higher frequency. Frequency and amplitude are distinct. Predicting received sound also needs distance, medium, losses and receiver response. The source records alone do not establish an exact perceived loudness.
Response criteria
- Use the supplied conditions and relevant evidence.
- Explain the scientific mechanism or calculation.
- State a meaningful limitation or testable next step.
Problem 6
Answer and explanation
Pitch is associated with the shared frequency, while loudness may differ with amplitude under comparable source, medium, distance and receiver conditions. Neither quantity is a universal perception guarantee.
Pitch is associated with the shared frequency, while loudness may differ with amplitude under comparable source, medium, distance and receiver conditions. Neither quantity is a universal perception guarantee.
Response criteria
- Use the supplied conditions and relevant evidence.
- Explain the scientific mechanism or calculation.
- State a meaningful limitation or testable next step.
Problem 7
Answer and explanation
Amplitude and frequency can vary independently. Compare graph height and cycles per stated time separately.
Amplitude and frequency can vary independently. Compare graph height and cycles per stated time separately.
Response criteria
- Use the supplied conditions and relevant evidence.
- Explain the scientific mechanism or calculation.
- State a meaningful limitation or testable next step.
Problem 8
Answer and explanation
A simplified chain is ruler → nearby air → farther air → receiver. A paper membrane can be a model receiver, but detectable motion depends on many factors. Failure to see it move at quiet volume is not evidence that energy transfer never occurs. The intermediate medium and interactions, and how the receiver responds. The picture should also identify limits such as scale and omitted biological detail.
A simplified chain is ruler → nearby air → farther air → receiver. A paper membrane can be a model receiver, but detectable motion depends on many factors. Failure to see it move at quiet volume is not evidence that energy transfer never occurs. The intermediate medium and interactions, and how the receiver responds. The picture should also identify limits such as scale and omitted biological detail.
Response criteria
- Use the supplied conditions and relevant evidence.
- Explain the scientific mechanism or calculation.
- State a meaningful limitation or testable next step.
Problem 9
Hints
Distinguish the observed quantities, the proposed mechanism and its conditions.
Answer and explanation
Both have frequency 200 Hz; amplitude doubles. Frequency-related pitch is comparable in the simple model, while received loudness also depends on distance, medium and receiver. The amplitude comparison alone does not fix a person’s perception.
Both have frequency 200 Hz; amplitude doubles. Frequency-related pitch is comparable in the simple model, while received loudness also depends on distance, medium and receiver. The amplitude comparison alone does not fix a person’s perception.
Problem 10
Hints
Distinguish the observed quantities, the proposed mechanism and its conditions.
Answer and explanation
Pitch is associated with the shared frequency, while loudness may differ with amplitude under comparable source, medium, distance and receiver conditions. Neither quantity is a universal perception guarantee.
Pitch is associated with the shared frequency, while loudness may differ with amplitude under comparable source, medium, distance and receiver conditions. Neither quantity is a universal perception guarantee.
Problem 11
Answer and explanation
Neither has a higher frequency in this matched window. Displacement amplitude differs; a numerical vertical position scale and units are needed to measure it.
A cycle is one complete repeat, such as one peak to the next matching peak. A taller trace does not automatically have more cycles. Compare amplitude and frequency one at a time rather than using the word louder for both.
Neither has a higher frequency in this matched window. Displacement amplitude differs; a numerical vertical position scale and units are needed to measure it.
Response criteria
- Use the named labels, directions or supplied quantities accurately.
- Connect the visual evidence to the scientific mechanism or calculation.
- State the relevant model conditions or limitation.
Problem 12
Answer and explanation
Period 0.2 s; frequency 5 Hz; amplitude 3 mm; peak-to-trough span 6 mm. The source moves locally rather than traveling across the sound path.
Use matching-peak separation for period and its reciprocal for frequency.
Measure amplitude from the middle position to a peak.
Period 0.2 s; frequency 5 Hz; amplitude 3 mm; peak-to-trough span 6 mm. The source moves locally rather than traveling across the sound path.
Response criteria
- Use the named labels, directions or supplied quantities accurately.
- Connect the visual evidence to the scientific mechanism or calculation.
- State the relevant model conditions or limitation.
Problem 13
Answer and explanation
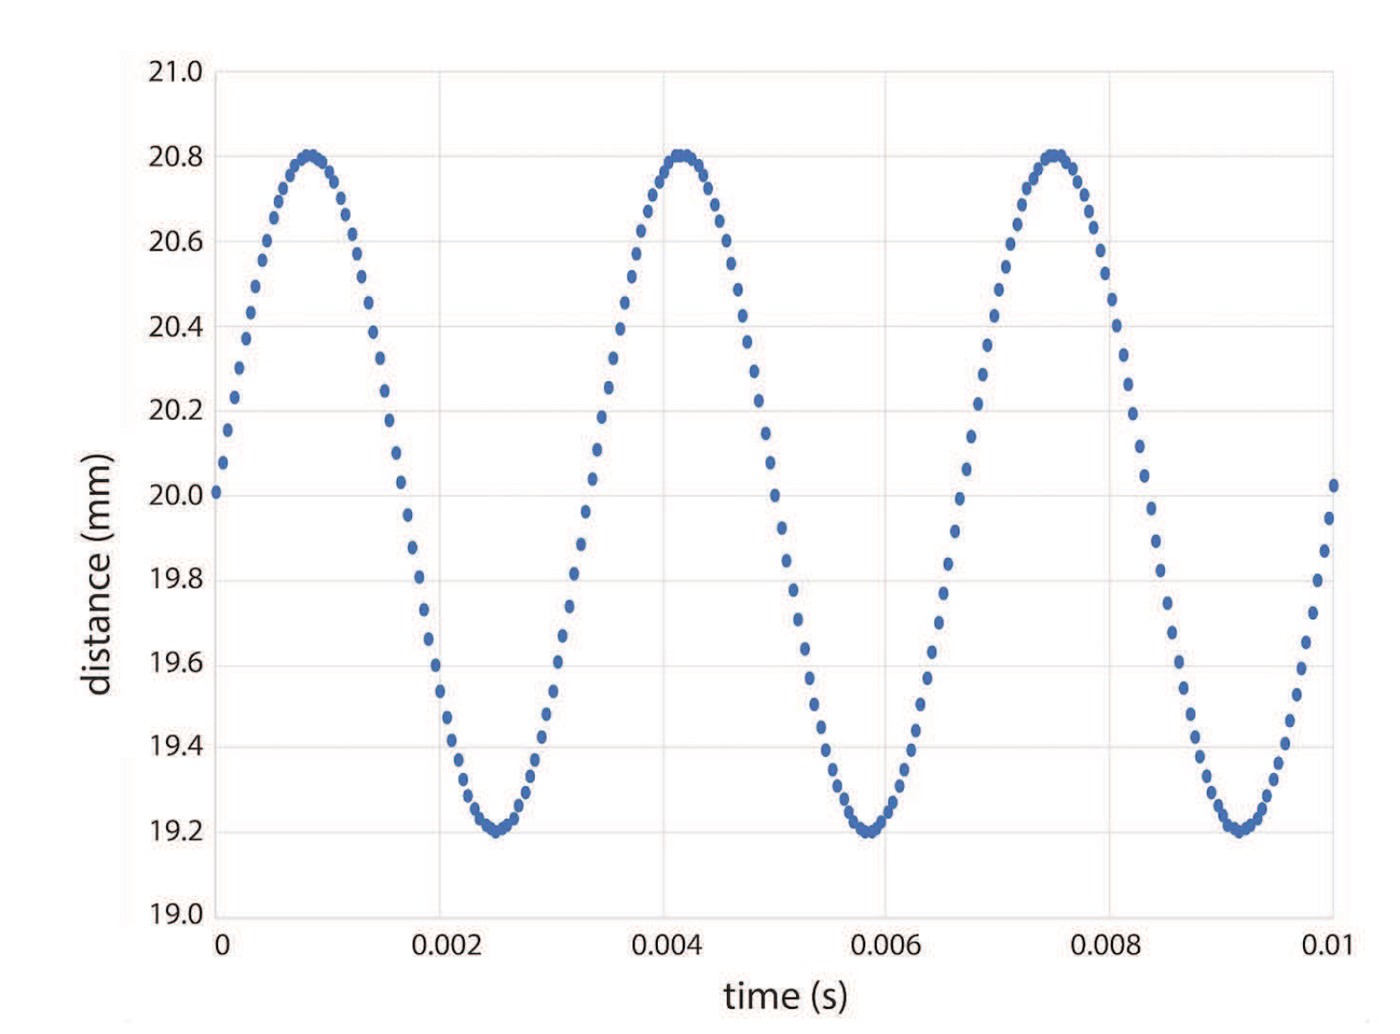
One cycle takes about 0.0033 s, giving frequency about 300 Hz using cycles per second = 1/period. The midline is near 20 mm and extrema are about 19.2 and 20.8 mm, so displacement amplitude is about 0.8 mm. Amplitude measures departure from the midline, not distance from the coordinate origin. Allow reasonable approximate readings from this source graph.
Compare consecutive peaks: about 0.0033 s per cycle.
Compute 1/period, approximately 300 cycles per second, or Hz.
Amplitude is about 20.8−20 = 0.8 mm (half the peak-to-peak displacement).
Response criteria
- Read time on the horizontal axis; do not call it wavelength.
- Estimate frequency from repeats per second.
- Measure amplitude from the midline and distinguish coordinate origin from equilibrium.
Problem 14
Answer and explanation
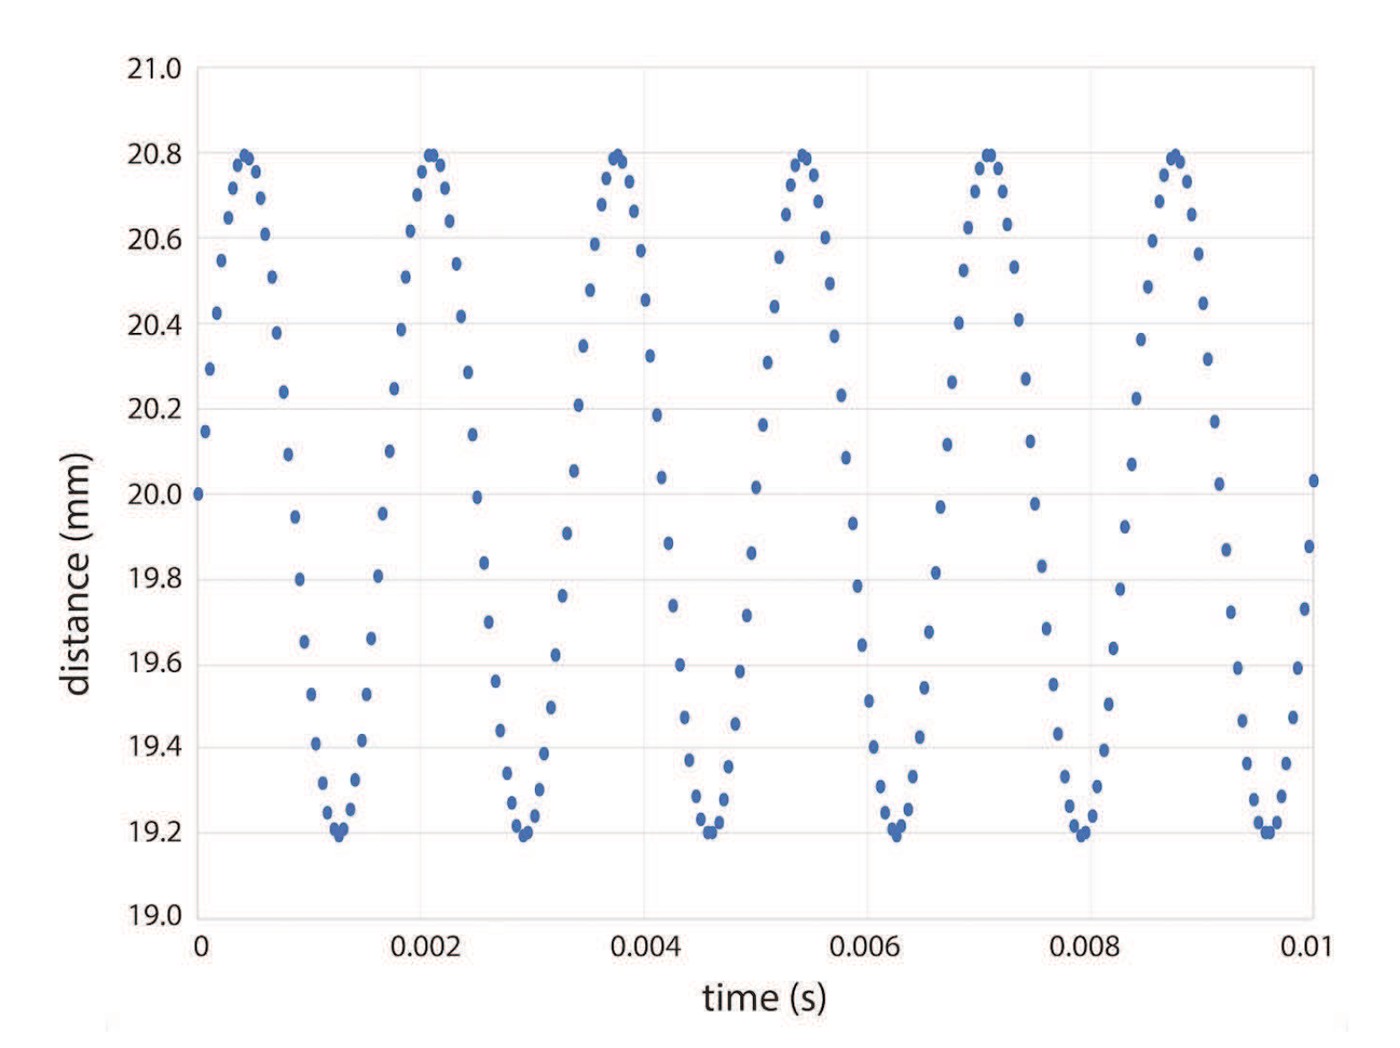
One cycle takes about 0.0017 s, giving frequency about 600 Hz using cycles per second = 1/period. The midline is near 20 mm and extrema are about 19.2 and 20.8 mm, so displacement amplitude is about 0.8 mm. Amplitude measures departure from the midline, not distance from the coordinate origin. Allow reasonable approximate readings from this source graph. B has about twice A’s frequency and half its period, while displacement amplitude stays approximately 0.8 mm. Faster repetition does not automatically mean a larger vibration.
Compare consecutive peaks: about 0.0017 s per cycle.
Compute 1/period, approximately 600 cycles per second, or Hz.
Amplitude is about 20.8−20 = 0.8 mm (half the peak-to-peak displacement).
Response criteria
- Read time on the horizontal axis; do not call it wavelength.
- Estimate frequency from repeats per second.
- Measure amplitude from the midline and distinguish coordinate origin from equilibrium.
Problem 15
Answer and explanation
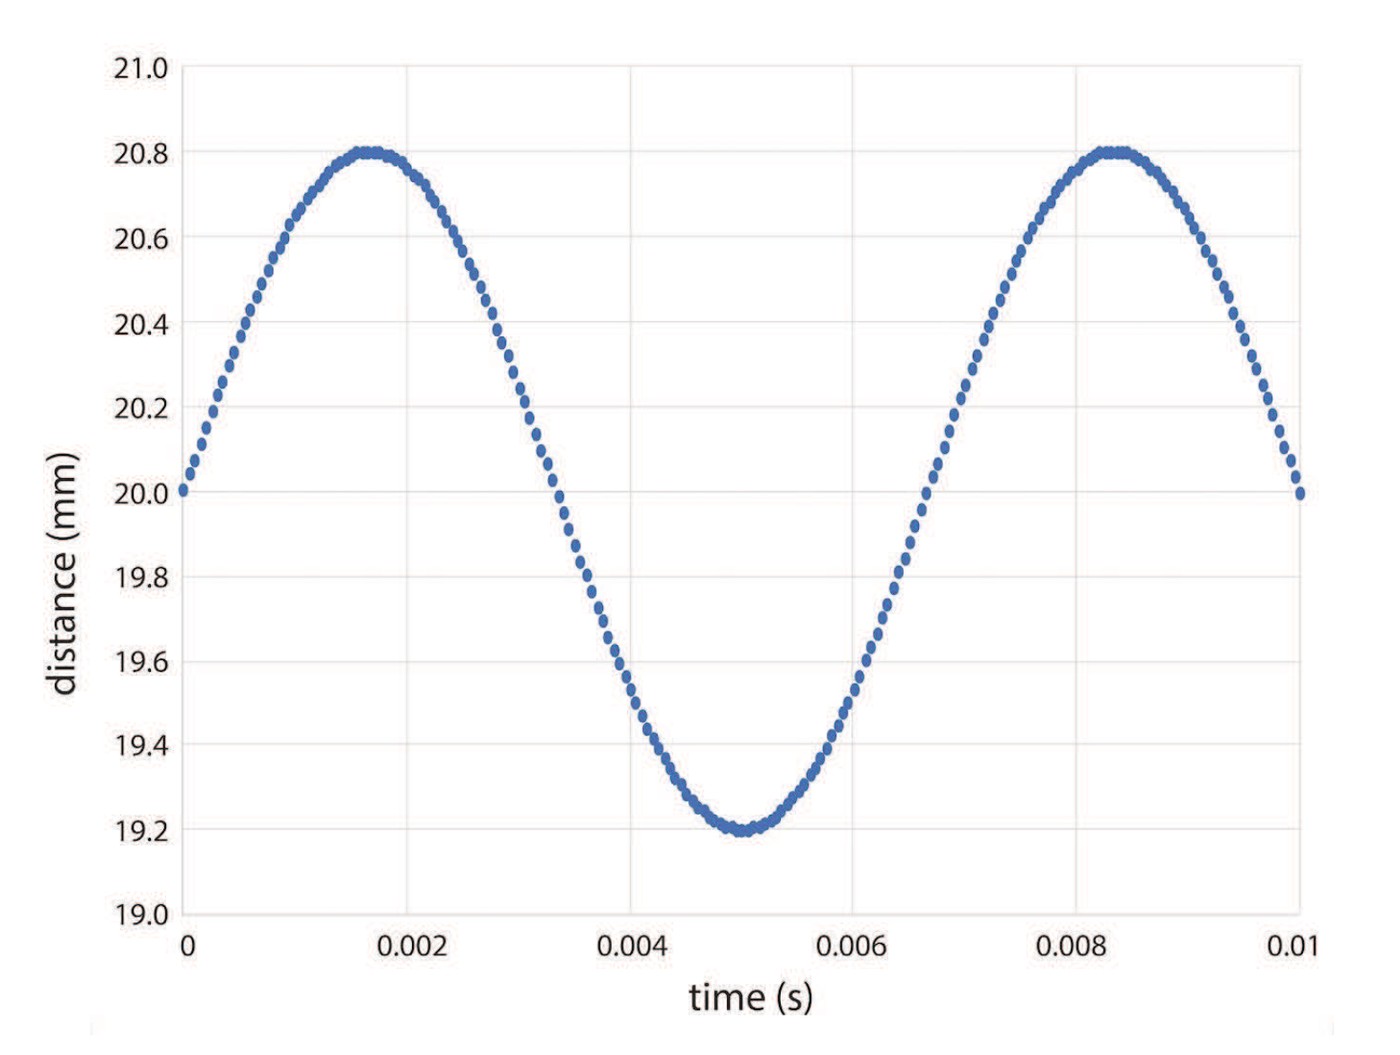
One cycle takes about 0.0067 s, giving frequency about 150 Hz using cycles per second = 1/period. The midline is near 20 mm and extrema are about 19.2 and 20.8 mm, so displacement amplitude is about 0.8 mm. Amplitude measures departure from the midline, not distance from the coordinate origin. Allow reasonable approximate readings from this source graph. About 1.5 cycles in 0.010 s gives 150 Hz. Counting only one ignores the half-cycle and would incorrectly give 100 Hz; use the measured period or account for the partial cycle.
Compare consecutive peaks: about 0.0067 s per cycle.
Compute 1/period, approximately 150 cycles per second, or Hz.
Amplitude is about 20.8−20 = 0.8 mm (half the peak-to-peak displacement).
Response criteria
- Read time on the horizontal axis; do not call it wavelength.
- Estimate frequency from repeats per second.
- Measure amplitude from the midline and distinguish coordinate origin from equilibrium.