Wave Properties · Grade 8 Science
Chapter: Waves, Sound & LightWave Properties
Learning goals
- I can identify the amplitude, wavelength, frequency, and period of a wave.
- I can calculate wave speed using v = f × λ.
Readings for this unit
Before this unit
Identify a repeating cycle, distance and time.
Use three teaching sessions of about 40–45 minutes: first observe the phenomenon, draft a model and study Parts 1–2; next explain Parts 3–4 with the figures and evidence; then work the application, examples, practice, model revision and exit check. Divide any difficult part into smaller steps and revisit after feedback. Investigations, review and quizzes have separate sessions. Study the four visual parts across the scheduled sessions, then use the illustrated worked case and independent transfer questions. Extend or revisit a session when the learner cannot explain the figure; completion time is a proposed allocation, not a mastery guarantee.
Start with something to explain
What would explain the observations in wave properties?
Illustrative evidence case. Illustrative waves in the same medium travel at 12 m/s. A has frequency 3 Hz and B 6 Hz. Their amplitudes are equal.
Notice and wonder
Can you count hertz from this snapshot alone? Write two observations from the supplied record without guessing their cause. Include a quantity and its unit when given. An observation is what was recorded; an inference is what you think explains it.
Write one question about why the pattern occurs and one question about a comparison that could distinguish competing explanations. A testable question identifies what could be observed or measured.
Your first model
Before reading the model answer, sketch the named objects or particles and label what you think changes. Find wavelengths, distinguish spatial from time graphs and identify a limit of an energy comparison based on amplitude alone. Keep this first version so you can compare it with your later explanation.
Build the language from the idea
- wave
- A traveling disturbance that transfers energy. In a simple mechanical wave, particles mainly move locally rather than travel the entire distance with the disturbance.
- amplitude
- Largest displacement from rest in a simple wave model. Greater amplitude can mean greater energy under comparable medium, frequency and wave conditions.
- wavelength (λ)
- The distance between two matching points on a wave, like crest to crest.
- frequency (f)
- The number of waves passing a point each second, measured in hertz (Hz).
- period (T)
- The time it takes for one full wave to pass, T = 1 ÷ f.
- model
- A representation that explains selected features and makes predictions; it leaves other details out.
- evidence
- Relevant observations or records used to support or challenge a claim.
- system boundary
- The chosen limit separating the objects being studied from their surroundings.
- assumption
- A condition taken as true for a model or calculation and needing to be checked against the case.
A wave is a traveling disturbance that carries energy from one place to another without carrying matter along with it. That last part surprises people, so picture a leaf floating on a pond: when ripples pass by, the leaf just bobs up and down in place — it doesn't get swept across the pond. The energy moves forward, but the water (and the leaf riding on it) mostly stays put. Ocean waves, sound, and light are all waves moving energy this way.
Every wave can be described by a handful of key measurements. Amplitude is the height of the wave measured from its rest position up to a crest (its peak). Amplitude matters because it's tied directly to energy: the taller the wave, the more energy it's carrying. A gentle ripple has a small amplitude and little energy, while a towering storm wave has a huge amplitude and enough energy to knock you off your feet.
Wavelength (λ) is the distance between two matching points on a wave — most easily measured from one crest to the next. Frequency (f) counts how many complete waves pass a fixed point each second, measured in hertz (Hz); a frequency of 5 Hz means five whole waves stream by every second. Closely related is the period (T), the time it takes for just one full wave to pass. Frequency and period are two sides of the same coin — if many waves pass each second, each one must take very little time — so they're linked by T = 1 ÷ f.
These properties tie together in one of the most useful formulas in the unit: wave speed = frequency × wavelength, written v = f × λ. It makes intuitive sense — if lots of waves pass each second (high frequency) and each wave is long (big wavelength), the wave must be racing along quickly. The handy thing is that if you know any two of the three quantities (speed, frequency, wavelength), you can always rearrange the formula to find the third.
Understanding these few properties unlocks a huge range of technology and nature. The pitch of a musical note, the color of light, the station your radio tunes into, and the power of an ocean swell all come down to a wave's amplitude, wavelength, and frequency. Engineers who design antennas, musical instruments, or medical ultrasound machines are really just carefully controlling these same wave properties.
Frequency counts cycles each second and is measured in hertz; period is time per cycle. For a wave traveling in a uniform medium, speed=frequency×wavelength. Changing frequency usually changes wavelength when the medium keeps wave speed approximately fixed.
A wave transfers energy and information without requiring the medium to travel from source to receiver. Water can bob locally as a wave travels across a pond. Distinguish particle motion from the direction of wave propagation.
Amplitude measures displacement from equilibrium, not wavelength. In otherwise similar waves, a larger amplitude generally indicates more energy, while frequency changes the cycle rate. Read the vertical and horizontal axes before interpreting a wave drawing.
Build your understanding
Where this fits
This unit helps answer the chapter question: How do waves and circuits transfer energy and information? Keep a notebook table with the question, evidence, explanation and one unresolved issue. Revise a previous model only when you can name the new evidence or idea that changes it.
Use three teaching sessions of about 40–45 minutes: first observe the phenomenon, draft a model and study Parts 1–2; next explain Parts 3–4 with the figures and evidence; then work the application, examples, practice, model revision and exit check. Divide any difficult part into smaller steps and revisit after feedback. Investigations, review and quizzes have separate sessions.
Part 1 · Separate the traveling disturbance from local motion
A wave can carry energy while the material particles move locally. In a transverse model, local motion is perpendicular to travel; in a longitudinal model it is parallel. Real surface-water motion is more complex than a simple up-down string model, so label the model’s limits.
Read the visual model
Follow one material marker rather than only a crest. A transverse rope wave has local motion perpendicular to travel. Sound uses a different local-motion direction, so do not assume every mechanical wave looks like a vertical rope curve.
What is wrong with tracing the red rope mark along the moving crest to the far right?
Visual reasoning — after your attempt
That would confuse the traveling pattern with the local motion of the material. The marked rope location oscillates locally rather than being carried across with the crest.
A point on a string moves up and down while a disturbance travels along it. The point does not ride from the source to the far end. Draw separate arrows for local displacement and wave-travel direction.
Pause and explain
Does a traveling pulse require every particle to travel with it?
Check your reasoning after answering
No. Particles can move locally while interactions pass the disturbance and energy along. The travel of the pattern differs from bulk transport of matter.
Part 2 · Measure wavelength and amplitude on a spatial graph
Wavelength is distance between matching points of a repeating wave, such as adjacent crests. Amplitude is maximum displacement from equilibrium. A spatial snapshot has position on its horizontal axis; a time record at one point uses time instead. These graphs cannot be interpreted with identical horizontal-axis rules.
Read the visual model
Why is crest-to-trough height not the amplitude?
Visual reasoning — after your attempt
Amplitude measures maximum displacement from equilibrium. For a symmetric wave the full crest-to-trough height is twice the amplitude.
If neighboring crests are 0.5 m apart, wavelength is 0.5 m. If a crest is 0.04 m above equilibrium, amplitude is 0.04 m; the crest-to-trough height would be twice that for a symmetric sinusoidal model.
Pause and explain
Why is crest-to-trough height not the amplitude?
Check your reasoning after answering
Amplitude measures maximum displacement from equilibrium. For a symmetric wave the full crest-to-trough height is twice the amplitude.
Part 3 · Link cycle rate and wave speed
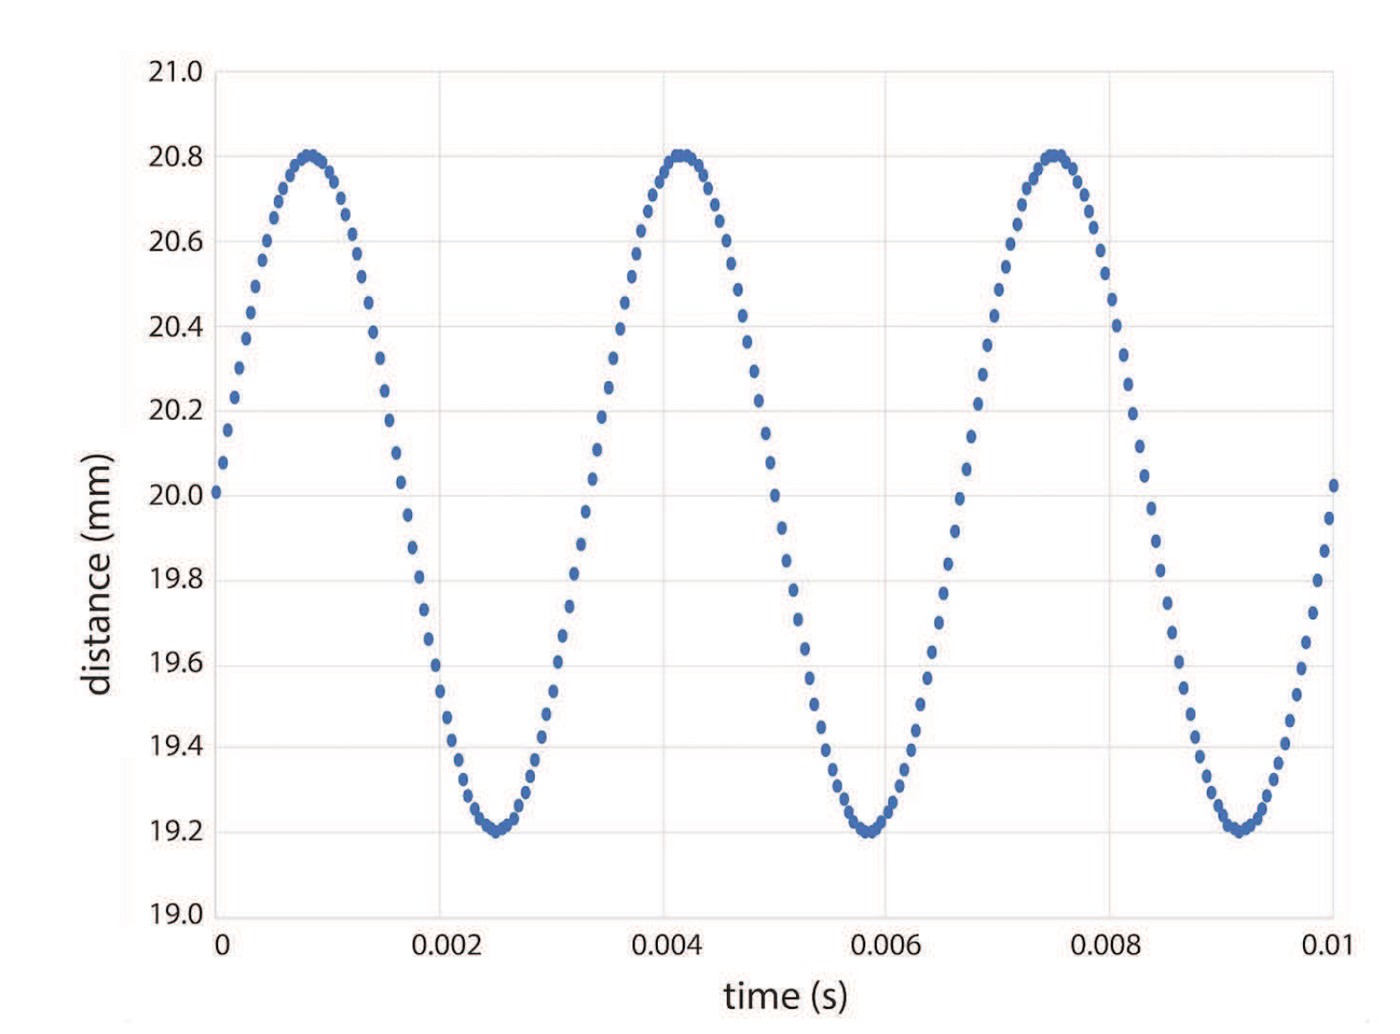
Frequency counts cycles per second in hertz; period is seconds per cycle. For a repeating wave, speed=frequency×wavelength. Changing source frequency in the same nondispersive model medium changes wavelength rather than necessarily changing wave speed. State the medium and model assumptions.
Read the visual model
Spatial means position across a region; temporal means change with time. Read the horizontal axis before interpreting a wavy line. Two curves that look alike can describe different quantities if one uses distance and the other time.
For the same frequency but a measured wavelength 2 m, what speed follows? Does the result identify a universal wave speed?
Visual reasoning — after your attempt
8 m/s follows for that supplied wave. It does not establish a universal speed; the wave type, medium and conditions must be stated.
A 4 Hz wave with wavelength 0.5 m travels at 2 m/s. At the same speed, doubling frequency to 8 Hz reduces wavelength to 0.25 m. Do not assume every higher-frequency wave in every medium travels faster.
Pause and explain
What happens to wavelength when frequency doubles at fixed speed?
Check your reasoning after answering
Wavelength halves, because speed=f×wavelength must remain the same. This conclusion uses the fixed-speed assumption.
Part 4 · Compare energy under matched conditions
For otherwise comparable waves, greater amplitude generally means more transferred energy. The exact relationship depends on the wave type and medium. Frequency, amplitude, and wavelength are distinct quantities; a taller wave drawing does not necessarily mean more cycles per second. Use separate measurements.
Read the visual model
Relative units compare amounts to a chosen reference rather than supplying joules directly. Read what is held constant before using a curve to compare different sounds, media or durations.
If amplitude doubles from 1 to 2 in this matched model, how does represented energy change? Which conditions must stay matched?
Visual reasoning — after your attempt
Energy rises from 1 to 4 units, a factor of four. Wave type, medium, frequency and duration must remain comparable for this simplified relation.
Two string-wave records can have the same frequency but different amplitude. Count cycles during the same interval for frequency and measure displacement for amplitude. A sketch without scale cannot support a precise energy comparison.
Pause and explain
Can two waves have equal frequency but different amplitude?
Check your reasoning after answering
Yes. Cycle rate and maximum displacement describe different features. Their energy transfers may differ under otherwise comparable conditions.
Apply the whole unit · Read a wave record
Illustrative wave: a point completes 12 cycles in 3 s; adjacent crests in a spatial snapshot are 0.6 m apart; crest displacement from equilibrium is 0.05 m. Assume a repeating wave at constant speed.
Your task
Calculate frequency, period, and wave speed. Label wavelength and amplitude on a sketch, distinguish local motion from travel, and predict wavelength if frequency doubles at the same speed.
What your response should show
- Use the supplied observations and measurements accurately; include units where needed.
- Explain the science behind your answer, rather than giving only a number or label.
- Show a labeled model, calculation, or evidence comparison as requested.
- State an assumption or limitation and suggest a useful next measurement.
Response guidance — after your attempt
Frequency=12/3=4 Hz; period=1/4=0.25 s; speed=4×0.6=2.4 m/s. Amplitude is 0.05 m. At 8 Hz and the same speed, wavelength is 0.3 m. Draw local particle motion separately from the travel arrow. The prediction uses a fixed-speed repeating-wave model.
Scientific references and adapted teaching resources
- OpenSciEd 8.2 Sound Waves — public unit overview
- OpenSciEd 8.3 Forces at a Distance — public unit overview
- OpenSciEd instructional model — storyline routines
- Creative Commons Attribution 4.0 — middle-school material license
Parent / teacher teaching notes
This required waves unit follows the force and energy chapters. Have the learner name horizontal axes before reading a wave graph. Keep amplitude, cycle count, and crest spacing in separate columns. Adaptation credit: OpenSciEd middle-school teaching routines and public task structures by OpenSciEd, CC BY 4.0. This independent version adds original explanatory text, data and figures, terminology support and a home-study schedule. It does not reproduce the complete teacher editions or their classroom validation.
The key idea
Wave speed = frequency × wavelength (v = f × λ); amplitude relates to energy, and period is the inverse of frequency (T = 1/f).
Wave Speed
v = f × λ
f is frequency in hertz (Hz); λ is wavelength in meters (m); v is wave speed in m/s.
Period
T = 1 ÷ f
T is the period in seconds; f is frequency in Hz.
Worked examples
Example 1
- Use v = f × λ.
- v = 5 × 2.
- = 10.
Example 2 · Worked application
- Frequency=cycles/time=12/3=4 Hz.
- Use v=fλ.
- v=4×2=8 m/s.
Hz means cycles per second, not meters per second.
Example 3
- Rearrange v = f × λ to solve for frequency: f = v ÷ λ.
- f = 20 ÷ 4.
- = 5.
Example 4
- Frequency=v/λ=12/3=4 Hz.
- Period=1/f=1/4=0.25 s.
Example 5 · Find and fix the mistake
- Test the claim against the stated conditions: Hz means cycles per second, not meters per second.
- Amplitude and frequency describe different properties. Changing height does not alone determine how often cycles pass.
Hz means cycles per second, not meters per second.
Example 6 · Interpret the visual model
- Identify the represented objects, axes, labeled quantities and stated conditions before choosing a rule.
- Follow one material marker rather than only a crest. A transverse rope wave has local motion perpendicular to travel. Sound uses a different local-motion direction, so do not assume every mechanical wave looks like a vertical rope curve.
- That would confuse the traveling pattern with the local motion of the material. The marked rope location oscillates locally rather than being carried across with the crest.
Keep the model’s stated limits explicit: The three conceptual rope snapshots show a pattern shifting along the rope while a marked location retains its horizontal coordinate and changes vertical position. The rope wave carries a disturbance and energy; a piece of rope does not need to move from source to receiver. These qualitative snapshots omit time scales and are not a calibrated wave-speed measurement.
Avoid these mistakes
- Particles of a medium need not travel with the wave from source to receiver.
Check your understanding
A wave travels at 12 m/s with wavelength 3 m. Find frequency and period.
Discuss the answer
4 Hz and 0.25 s per cycle.
How do wavelength and amplitude appear differently on a wave diagram?
Discuss the answer
Frequency counts cycles each second and is measured in hertz; period is time per cycle. For a wave traveling in a uniform medium, speed=frequency×wavelength. Changing frequency usually changes wavelength when the medium keeps wave speed approximately fixed. A wave transfers energy and information without requiring the medium to travel from source to receiver. Water can bob locally as a wave travels across a pond. Distinguish particle motion from the direction of wave propagation.
Return to the phenomenon
Illustrative waves in the same medium travel at 12 m/s. A has frequency 3 Hz and B 6 Hz. Their amplitudes are equal. Find wavelengths, distinguish spatial from time graphs and identify a limit of an energy comparison based on amplitude alone. Revise your first explanation using a named idea from the lesson. Mark the changed part and the evidence that supports it.
Compare explanations after your attempt
Using wavelength=speed/frequency, A is 4 m and B 2 m. A displacement–distance graph shows wavelength; a displacement–time graph shows period and frequency at a location. Equal amplitude does not generally establish equal energy for different frequencies or wave conditions; specify the medium, frequency and model for energy comparisons.
What should we investigate next?
Which condition could be changed to test a remaining uncertainty in this explanation? State the predicted observation and what result would challenge your model.
Investigate, explain and revise
Use these tasks after the three teaching sessions as needed. Discuss an attempted explanation before opening response guidance; a matching sentence is less important than a supported mechanism.
Activity 1 · Explain the new evidence case
Use the visible scenario above, Parts 1–4 and your first notebook model. No outside reading or equipment is required.
Your task
Illustrative waves in the same medium travel at 12 m/s. A has frequency 3 Hz and B 6 Hz. Their amplitudes are equal. Find wavelengths, distinguish spatial from time graphs and identify a limit of an energy comparison based on amplitude alone. Write 100–150 words or give a labeled drawing with an equivalent oral explanation.
Success criteria
- Use two relevant stated records or conditions.
- Explain the mechanism rather than only repeat a definition.
- Label observation and inference.
- Name a changed model feature or a remaining uncertainty.
Hint
Read the stated boundary and conditions before selecting a relationship. The unit’s worked examples show intermediate steps.
Response guidance — discuss after your attempt
Using wavelength=speed/frequency, A is 4 m and B 2 m. A displacement–distance graph shows wavelength; a displacement–time graph shows period and frequency at a location. Equal amplitude does not generally establish equal energy for different frequencies or wave conditions; specify the medium, frequency and model for energy comparisons.
Activity 2 · Read and extend the figure
Study the new labeled figure and its caption, then compare it with the associated teaching part.
Your task
Can you count hertz from this snapshot alone? Explain what each important label represents. Add one missing feature that would be needed for a different question, and explain why the original figure leaves it out.
Success criteria
- Answer the figure question with its stated labels.
- Connect the visual representation to the scientific idea.
- Identify a specific limitation from the caption.
- Propose a useful change without misrepresenting supplied evidence.
Hint
This displacement-versus-position snapshot labels amplitude from rest and wavelength between matching crests. It does not show frequency without time information, and it is not a drawing of a sound particle’s entire travel path. Units are identified; the sketch does not assign numerical tick values.
Response guidance — discuss after your attempt
No. Frequency requires cycles per time, not merely the number of crests in a spatial drawing. This displacement-versus-position snapshot labels amplitude from rest and wavelength between matching crests. It does not show frequency without time information, and it is not a drawing of a sound particle’s entire travel path. Units are identified; the sketch does not assign numerical tick values.
Words to know
- wave
- A traveling disturbance that transfers energy. In a simple mechanical wave, particles mainly move locally rather than travel the entire distance with the disturbance.
- amplitude
- Largest displacement from rest in a simple wave model. Greater amplitude can mean greater energy under comparable medium, frequency and wave conditions.
- wavelength (λ)
- The distance between two matching points on a wave, like crest to crest.
- frequency (f)
- The number of waves passing a point each second, measured in hertz (Hz).
- period (T)
- The time it takes for one full wave to pass, T = 1 ÷ f.
- model
- A representation that explains selected features and makes predictions; it leaves other details out.
- evidence
- Relevant observations or records used to support or challenge a claim.
- system boundary
- The chosen limit separating the objects being studied from their surroundings.
- assumption
- A condition taken as true for a model or calculation and needing to be checked against the case.
Waves move energy, not matter — proof from a floating duck
Watch a duck floating on a pond as a wave passes underneath: the duck bobs up and down in place, but it doesn't get swept along with the wave toward shore. That's because a wave transfers energy through a medium without permanently transporting the medium's matter along with it — each water particle mostly moves in a small circle and returns close to where it started. It's the same idea behind 'the wave' at a stadium: no single fan actually travels around the stadium, they just stand and sit in place while the pattern of motion races past them.
Why doubling amplitude actually quadruples the energy
The main lesson says bigger amplitude means more energy, but the actual relationship is sharper than that: a wave's energy is proportional to its amplitude squared, not just its amplitude. Double a wave's amplitude, and it carries four times the energy — the exact same doubling-squares-to-quadrupling pattern you'll see with kinetic energy (KE = ½mv²) in the Energy unit. This is why a tsunami, with an amplitude many times larger than a normal ocean wave, carries a wildly disproportionate amount of destructive energy, not just a 'somewhat bigger' amount.
P waves and S waves: how scientists locate an earthquake's epicenter
Earthquakes send out two main types of seismic waves that travel at different speeds: fast P waves (primary waves, which squeeze and stretch the ground like a longitudinal wave) and slower S waves (secondary waves, which shake the ground side to side like a transverse wave). Seismologists measure the time gap between a P wave and S wave arriving at a monitoring station — the bigger the gap, the farther away the earthquake happened — and combine readings from three or more stations to pinpoint the exact epicenter, the same way you might triangulate a sound's source.
Christiaan Huygens, Isaac Newton, and 300 years of arguing about waves
In the 1670s, Dutch scientist Christiaan Huygens proposed that light travels as a wave, while Isaac Newton favored the idea that light was made of tiny particles ('corpuscles'). Newton's enormous scientific reputation kept the particle theory dominant for over a century, until Thomas Young's 1801 double-slit experiment showed light behaving unmistakably like a wave, creating interference patterns that only waves produce. The debate wasn't fully resolved even then — twentieth-century physics eventually revealed that light behaves as both a wave and a particle, depending on how you look for it.
In the real world
Radio stations broadcast at specific frequencies, and knowing wave speed helps engineers design antennas of the right size to receive them.
Exit check
Can you count hertz from this snapshot alone? Explain the relevant mechanism and one model limitation.
Check your explanation after answering
No. Frequency requires cycles per time, not merely the number of crests in a spatial drawing. This displacement-versus-position snapshot labels amplitude from rest and wavelength between matching crests. It does not show frequency without time information, and it is not a drawing of a sound particle’s entire travel path. Units are identified; the sketch does not assign numerical tick values.
Explain your reasoning without notes. If a key idea is missing, revisit the lesson and try again.