Human Impact & Conservation — Practice · Grade 10 Science
Chapter: Ecosystems & Conservation DecisionsWhat this practice covers
By the end of Human Impact & Conservation you should be able to:
- I can describe the major ways humans disrupt ecosystems — climate change, pollution, habitat loss, and invasive species — and how they threaten biodiversity.
- I can explain strategies for conservation and sustainability that reduce human impact.
11 questions, multiple choice, numeric and written answer, each with a worked explanation.
Vocabulary used: biodiversity, greenhouse gas, habitat fragmentation, invasive species, sustainability, conservation.
Problem 1
- Collecting animals for zoos
- Too many decomposers
- Volcanic eruptions
- Habitat loss and fragmentation
Answer and explanation
Habitat loss and fragmentation
Destroying and fragmenting habitat removes the places species need to live and is the biggest driver of biodiversity loss.
Problem 2
- absorb and re-radiate heat that would otherwise escape to space
- block sunlight from ever reaching Earth's surface
- cool the atmosphere by releasing oxygen
- destroy the ozone layer directly
Answer and explanation
absorb and re-radiate heat that would otherwise escape to space
Greenhouse gases let sunlight in but trap outgoing heat (infrared), re-radiating some of it back toward the surface and warming it.
Problem 3
Answer and explanation
2 ppm
0.02 × 10 × 10 = 2 ppm.
Problem 4
- Native species immediately go extinct on their own
- They arrive without the predators, diseases, and competitors that limited them back home
- They can survive without any energy source
- New ecosystems always have unlimited resources
Answer and explanation
They arrive without the predators, diseases, and competitors that limited them back home
Without their usual limiting factors, invasive populations can grow explosively and outcompete native species.
Problem 5
Answer and explanation
A personal action is reducing, reusing, and recycling, which cuts the demand for raw materials and energy and lessens pollution and habitat destruction from extracting new resources. A societal action is shifting from fossil fuels to renewable energy like solar and wind, which lowers greenhouse gas emissions and slows climate change. Both meet human needs while using resources at a rate ecosystems can sustain, protecting biodiversity for the future. (Other valid answers include protecting habitat, sustainable farming or fishing, and using less water or energy.)
Problem 6
Answer and explanation
Use is plausible; population recovery is not established by sightings alone.
Sightings suggest corridor use, but detectability and sampling effort matter.
Population growth needs independent abundance or reproduction evidence.
Response criteria
- Use the stated conditions.
- Show the evidence or calculation.
- Explain the conclusion and any stated limitation.
Problem 7
Hints
The success measure must match the conservation goal.
Answer and explanation
Different interventions address different mechanisms; connectivity does not necessarily reduce pollutant inputs.
Problem 8
Hints
State what the supplied observations or conditions establish, and separate that from any assumption.
Answer and explanation
Baseline, indicators, comparable methods, timing, uncertainty and criteria for revising the intervention.
Problem 9
Answer and explanation
Detection changed with the intervention period and can increase counts; comparable sampling or modeled correction is needed.
Detection probability is the chance of observing a present organism under a sampling method. A count can rise when effort, access, season or tools change even without equal population growth. An intervention evaluation needs baseline and follow-up measurements with suitable comparison sites and comparable methods. Before–after evidence establishes temporal order but does not alone isolate cause. Several indicators can reveal tradeoffs that one abundance measure hides, including condition, reproduction, habitat quality and unintended effects.
Detection changed with the intervention period and can increase counts; comparable sampling or modeled correction is needed.
Response criteria
- Read the structures, axes, directions and units correctly.
- Connect the evidence with the biological mechanism.
- Respect stated model assumptions and distinguish an observation from a further inference.
Problem 10
Answer and explanation
The raw count rises 50%, but changed detection can contribute. Use comparable effort/methods, suitable reference sites and repeated population/condition indicators; estimate detection where appropriate before attributing recovery.
The raw count rises 50%, but changed detection can contribute. Use comparable effort/methods, suitable reference sites and repeated population/condition indicators; estimate detection where appropriate before attributing recovery.
Response criteria
- Use the stated measurements or conditions, with correct units.
- Connect the result to the biological mechanism or evidence relationship.
- Identify the assumption, model limit or further evidence requested.
Problem 11
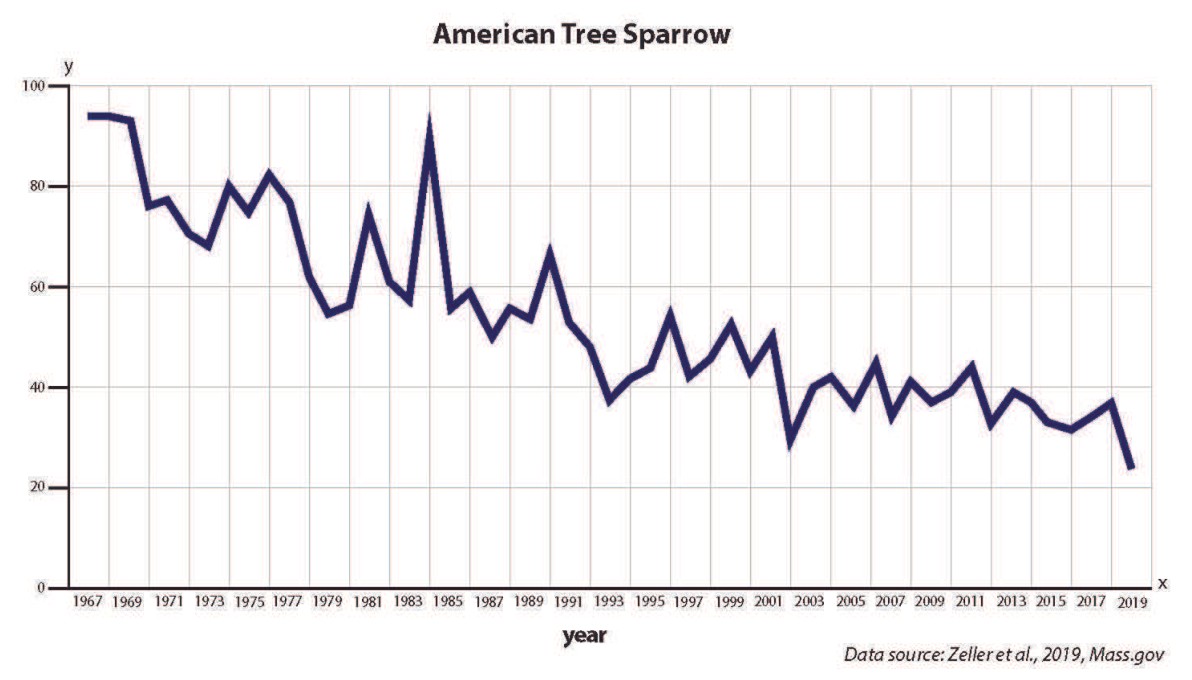
Answer and explanation
Acreage measures US land planted in millions of acres over 1997–2017; the bird indicator covers a longer selected historical period through 2019 and has no stated census/percentage unit. Their regions, methods and other conditions require clarification. Broad opposing patterns can motivate a habitat hypothesis, but matched local habitat/bird monitoring with comparable effort, relevant controls and alternative pressures would test causality more directly.
Keep land area separate from an abundance indicator.
Check years, area and method; do not convert the bird axis into percent without definition.
Propose comparable local surveys and control for detection/other pressures.
Response criteria
- Identify the different variables and periods.
- Do not invent a bird census or percentage unit.
- Explain causal limits and propose appropriate matched evidence.