Human Impact & Conservation · Grade 10 Science
Chapter: Ecosystems & Conservation DecisionsHuman Impact & Conservation
Learning goals
- I can describe the major ways humans disrupt ecosystems — climate change, pollution, habitat loss, and invasive species — and how they threaten biodiversity.
- I can explain strategies for conservation and sustainability that reduce human impact.
Readings for this unit
Before this unit
Compare evidence, trade-offs and a measurable success criterion.
Use three flexible study sessions: core explanation and Parts 1–2; Parts 3–4 with their reasoning checks and models; then the whole-unit application, worked examples, independent practice, and exit check. Allow about 50–60 minutes per session, including diagrams, data work, and notebook explanations. Attempt each check before opening its guidance. Schedule chapter investigations, review, and exams separately; add time where prerequisites are uncertain. Trace the explained visual parts and write a first model, then attempt the illustrated and changed independent cases. In the third session explain a correction and revise the opening account using evidence.
Start with something to explain
Does more wildlife observed after a project prove that the project restored the population?
Illustrative evidence case. Intervention, survey effort and environmental conditions can change together.
Notice and wonder
Record two observations using the stated quantities or relationships. Keep observations separate from possible causes. Write one question that a new measurement could help answer.
Does more wildlife observed after a project prove that the project restored the population?
Your first model
Connect the specific threat, proposed mechanism, sampling and measured outcomes.
Build the language from the idea
- biodiversity
- The variety of life in an area — the number of different species, the genetic variety within them, and the range of ecosystems they form.
- greenhouse gas
- A gas such as carbon dioxide, methane, or water vapor that absorbs and re-radiates heat, warming the lower atmosphere.
- habitat fragmentation
- The breaking of a large, continuous habitat into smaller, isolated patches, usually by roads, farms, or development.
- invasive species
- A non-native species that spreads rapidly in a new ecosystem because it lacks the predators, diseases, or competitors that limited it back home.
- sustainability
- Using resources in a way that meets present needs without using them up or damaging the environment for future generations.
- conservation
- The careful protection and management of ecosystems, species, and natural resources to prevent their loss.
Human activities can change biodiversity, including genetic variation, species composition and ecosystem relationships. Major pressures include habitat loss/fragmentation, exploitation, pollution, climate-related changes and harmful introduced-species effects. Their importance varies with organism, region and interval. Biodiversity can influence functions and recovery through particular traits and interactions, but more species does not guarantee faster recovery under every disturbance. Use defined baselines and local mechanisms rather than an undated universal extinction multiplier or a blanket resilience claim.
The single biggest driver is habitat loss. As forests are cleared for farmland, wetlands are drained, and land is paved for cities, the places species need to live simply disappear. Even when some habitat survives, habitat fragmentation chops it into isolated islands separated by roads and fields. Fragmentation is more damaging than it looks: small, cut-off populations have less room to roam, less genetic diversity to draw on, and a far higher risk of blinking out one patch at a time. Protecting large, connected areas — and building wildlife corridors between them — is one of the most effective ways to preserve biodiversity.
Layered on top is climate change, driven by the buildup of greenhouse gases. Burning fossil fuels and clearing forests release carbon dioxide (along with methane and nitrous oxide) faster than the carbon cycle can absorb it. These gases let sunlight in but absorb and re-radiate the heat the Earth gives off, trapping extra energy near the surface — the same greenhouse effect that keeps the planet livable, now turned up too high. The consequences cascade: rising temperatures, melting ice and rising seas, more extreme storms and droughts, and oceans turning more acidic as they absorb CO₂. Many species can't shift their ranges or timing fast enough to keep up, so warming reshuffles entire communities.
Pollution is another pressure, and one with a sneaky twist. Beyond the obvious harm of oil spills, smog, and plastic-choked oceans, some pollutants magnify as they climb the food web. Certain toxins — mercury, or pesticides like the now-banned DDT — can persist or be eliminated slowly and accumulate in body tissue. Because each predator eats many contaminated prey, the poison grows more concentrated at every trophic level, a process called *biomagnification*. A chemical that is nearly harmless in the water can reach dangerous levels in top predators such as eagles, tuna, and humans — a direct link back to the energy-pyramid thinking from earlier in this unit.
Another biological pressure involves harmful invasive species. Moved to a new ecosystem by human trade and travel — sometimes on purpose, often by accident — these newcomers frequently arrive without the predators, parasites, and competitors that kept them in check back home. Freed from those limiting factors, their populations can explode along an exponential curve and overwhelm native species. Burmese pythons have devastated mammal populations in the Florida Everglades; zebra mussels have clogged Great Lakes waterways and starved out native shellfish. Overharvesting — overfishing the oceans, overhunting rare animals — adds still more strain, pushing already-stressed populations past their ability to recover.
The picture is serious, but it is not hopeless — because the same species causing the damage can also repair it. Conservation protects and restores ecosystems: national parks and marine reserves shield habitat, captive-breeding and reintroduction programs have pulled species like the California condor back from the brink, and laws such as the Endangered Species Act give threatened wildlife legal protection. Sustainability tackles the root causes by meeting human needs without exhausting the planet: shifting to renewable energy to cut greenhouse gases, farming and fishing at rates ecosystems can replenish, protecting wetlands and forests that store carbon, and the everyday habits of reducing, reusing, and recycling. Recovery varies with species, soil, dispersal, interactions and continuing pressures — which means the choices people make now genuinely determine what the living world looks like for generations to come.
Conservation decisions need a defined goal and baseline, such as habitat connectivity, species abundance or water quality. A protected area alone may not address threats outside its boundary. Compare the proposed mechanism with the measured problem.
Human effects interact: habitat fragmentation can reduce movement, pollution can change survival and introduced species can alter food webs. A simple diagram helps trace possible pathways, while actual impact requires field evidence. Avoid assuming every nonnative species has the same effect.
Monitor results across relevant seasons and compare with untreated sites when feasible. A short-term increase in one indicator may conceal decline elsewhere. A useful recommendation includes benefits, costs, uncertainty and a plan to revise if outcomes differ from predictions.
Build your understanding
Use three flexible study sessions: core explanation and Parts 1–2; Parts 3–4 with their reasoning checks and models; then the whole-unit application, worked examples, independent practice, and exit check. Allow about 50–60 minutes per session, including diagrams, data work, and notebook explanations. Attempt each check before opening its guidance. Schedule chapter investigations, review, and exams separately; add time where prerequisites are uncertain.
Part 1 · Five pressures, distinguished
Habitat loss removes suitable area; fragmentation changes its arrangement and isolation. Exploitation, pollution, climate-related changes and harmful introduced-species effects can act through different mechanisms. Nonnative means introduced outside an earlier range; invasive implies spread with relevant harmful impacts under the definition being used. Not every nonnative organism has the same effect. Compare affected species, resources and measured outcomes rather than attach one threat label to every decline. Broad biodiversity statements do not replace local causal evidence.
Read the visual model
Identify the labeled structures and units, then trace the arrows or compare values under the caption’s stated conditions. Separate the displayed evidence from a further inference. Write your reasoning before opening the guidance.
Would controlling harvest alone necessarily repair a decline caused mainly by lost breeding habitat?
Visual reasoning — after your attempt
No. A measure needs a plausible connection with the diagnosed pressure; multiple interacting threats may require different responses.
Human effects on ecosystems are usually grouped into habitat loss and fragmentation, pollution, invasive species, overharvesting, and climate change. Distinguishing them matters because they call for different responses: a corridor addresses fragmentation but not overharvesting, and a quota addresses overharvesting but not pollution.
They also interact. A fragmented habitat is more easily invaded along its edges; a harvested population reduced in numbers is less able to withstand a bad year; warming shifts the ranges species need while fragmentation blocks the movement that would track it. Treating them as a list of separate problems understates the difficulty, which is why conservation decisions usually involve several pressures at once.
Pause and explain
Why does fragmentation make invasion by introduced species more likely?
Check your reasoning after answering
Fragmentation increases the proportion of edge relative to interior, and edges are more disturbed and more exposed to arriving species. Smaller, more isolated populations of resident species are also less able to resist a new competitor.
Part 2 · Why area and connection matter
A corridor can connect habitat patches for selected organisms; it may also transmit disease, predators or invasive organisms. Edge effects concern changed conditions near a boundary and differ among species and habitat types. One large reserve and several smaller ones have different risks, accessibility and habitat representation; equal area alone cannot decide which design is best. Compare dispersal, habitat quality, disturbance, governance and affected groups. A structural map proposes a route rather than proving that every organism can use it.
Read the visual model
Identify the labeled structures and units, then trace the arrows or compare values under the caption’s stated conditions. Separate the displayed evidence from a further inference. Write your reasoning before opening the guidance.
Why might several separated reserves be useful despite reduced connection?
Visual reasoning — after your attempt
They can represent different habitats or reduce correlated disturbance risk, depending on species and threats; the design needs evidence and goals.
Population size is the link between habitat area and extinction risk. A larger area supports a larger population, which is less vulnerable to chance extinction and retains more genetic variation, since drift has smaller effects when numbers are large. A large patch also has proportionally less edge, preserving interior conditions that many species require.
Connection matters for the same reason. Corridors allow movement between patches, which maintains gene flow and allows a patch where a population has died out to be recolonized. The design question is genuinely contested: several separate patches give protection against a single catastrophe striking everything, so the answer depends on the species involved and the threats expected rather than on a general rule.
Pause and explain
Give one reason several separate reserves might be preferable to one large reserve of the same area.
Check your reasoning after answering
A single catastrophe — fire, disease outbreak, or storm — could affect an entire contiguous reserve at once, while separated patches are unlikely to be hit simultaneously, so some populations survive. The trade-off is smaller populations and less gene flow in each patch.
Part 3 · What evidence a measure needs
Detection probability is the chance of observing a present organism under a sampling method. A count can rise when effort, access, season or tools change even without equal population growth. An intervention evaluation needs baseline and follow-up measurements with suitable comparison sites and comparable methods. Before–after evidence establishes temporal order but does not alone isolate cause. Several indicators can reveal tradeoffs that one abundance measure hides, including condition, reproduction, habitat quality and unintended effects.
Read the visual model
Identify the labeled structures and units, then trace the arrows or compare values under the caption’s stated conditions. Separate the displayed evidence from a further inference. Write your reasoning before opening the guidance.
Why is attributing the whole jump to protection uncertain when survey effort increased?
Visual reasoning — after your attempt
Detection changed with the intervention period and can increase counts; comparable sampling or modeled correction is needed.
A conservation claim has the same requirements as any other experimental claim. It needs a baseline measured before the intervention, a comparison that did not receive the intervention, a stated indicator measured the same way throughout, and a monitoring interval. Without a comparison, a rise after a measure cannot be distinguished from a favourable period, a change in counting effort, immigration, or ordinary fluctuation.
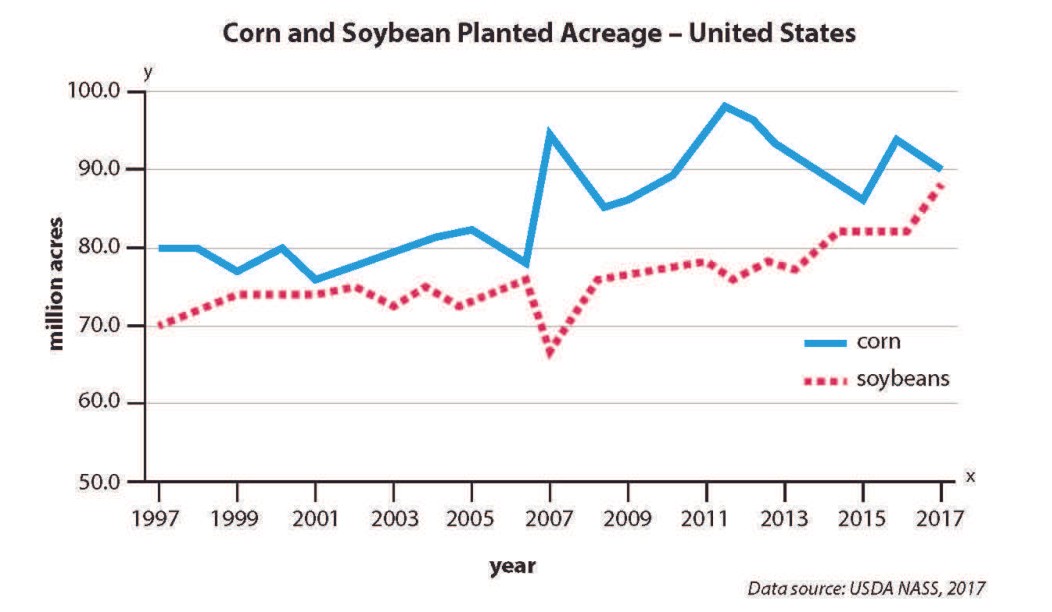
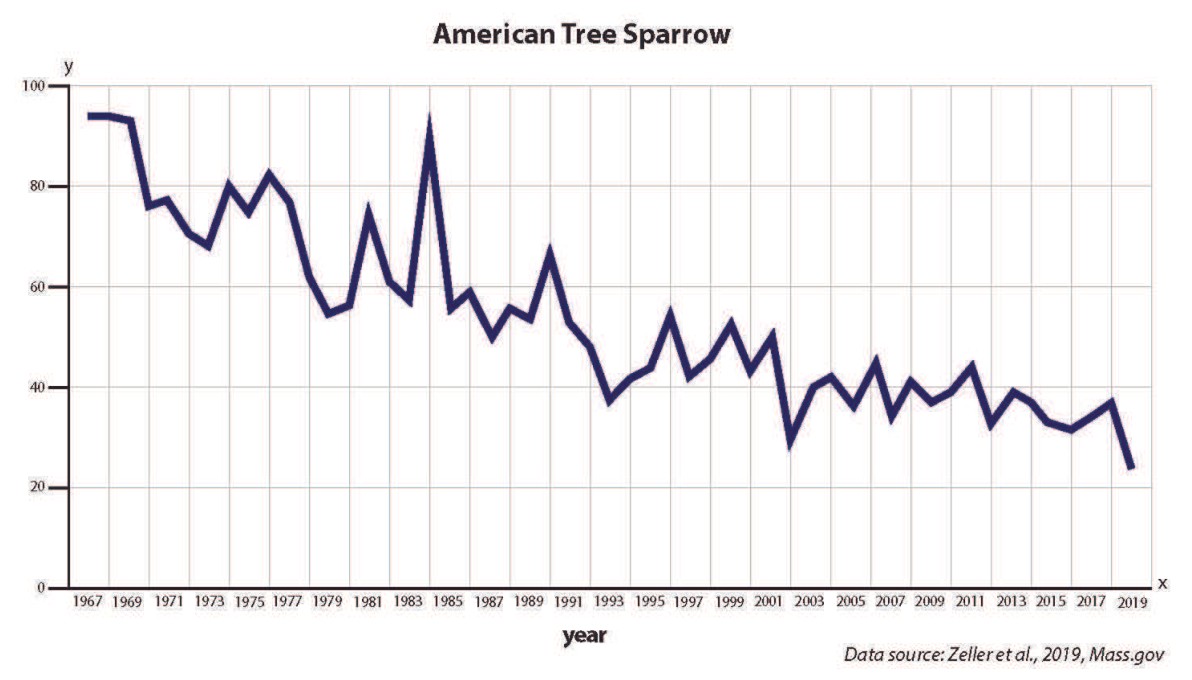
Monitoring design is where conservation claims most often fail, and the failure is usually in good faith: counts are taken more carefully after a measure is introduced because attention has increased, which inflates the apparent effect. Stating the method, the effort, and what result would count as failure is what makes a measure evaluable rather than merely defensible.
Pause and explain
A population is counted more thoroughly after a protection measure begins. What error does that introduce?
Check your reasoning after answering
Increased survey effort detects more individuals, so the count rises even if the population does not. The apparent improvement is an artefact of method, which is why the indicator and the effort must be held constant across the comparison.
Part 4 · Trade-offs, stated honestly
A criterion specifies a desired outcome; a constraint limits feasible choices. Evidence can estimate ecological effects, costs and uncertainties, while people’s values influence priorities, acceptable risks and how impacts are shared. Different groups may reasonably weigh outcomes differently, so state assumptions instead of portraying one score as the only scientifically permitted preference. Compare options with matched definitions and avoid adding unrelated units as if they were one physical total. A transparent proposal includes monitoring and revision when outcomes differ.
Read the visual model
Identify the labeled structures and units, then trace the arrows or compare values under the caption’s stated conditions. Separate the displayed evidence from a further inference. Write your reasoning before opening the guidance.
Can measurements alone decide how every community must weight access versus habitat outcomes?
Visual reasoning — after your attempt
No. Measurements inform consequences, while priorities and acceptable tradeoffs involve values and decision processes.
Conservation decisions allocate limited land, money, and attention, so protecting one thing generally means not protecting another or constraining some human use. A fishing restriction protects a stock and the people who will depend on it later while reducing catches now; the costs and benefits fall on different people and at different times, which is why these decisions are contested rather than merely technical.
Science can establish what is likely to happen under each option and with what uncertainty; it cannot by itself determine which outcome should be preferred. The most useful contribution is therefore a clear statement of the expected effects, their uncertainty, who bears the costs, and what will be measured — leaving the choice visible rather than concealing it inside a recommendation.
Pause and explain
What can evidence settle about a conservation decision, and what can it not?
Check your reasoning after answering
Evidence can estimate what each option is likely to produce and how uncertain that estimate is. It cannot determine how to weigh present costs against future benefits or whose interests should take priority, which are value judgements that belong to the people affected.
Apply the whole unit · Evaluate two conservation claims
Illustrative monitoring records. Claim 1: after a reserve was established, a bird population rose from 240 to 312 over five years, a 30 percent increase; survey effort rose from 20 to 34 observer-days per year over the same period. An unprotected comparison population surveyed at a constant 20 observer-days fell from 250 to 205. Claim 2: a fishery introduced a quota; catch fell from 27,000 to 19,000 tonnes while the estimated stock rose from 90,000 to 104,000 tonnes over four years, with stock estimated by the same survey method throughout.
Your task
Evaluate each claim, calculate the percentage changes involved, identify the specific weakness in Claim 1 and explain whether the comparison population rescues it, and state what makes Claim 2 the stronger of the two. Then name the one additional measurement that would most strengthen Claim 1.
What your response should show
- Choose the appropriate biological model or relationship and state the conditions it assumes.
- Show the counts, rates, ratios, or intermediate reasoning the question requires.
- Use the supplied evidence to justify the conclusion and separate observation from inference.
- Identify a meaningful limitation, uncertainty, or next measurement.
Response guidance — after your attempt
Claim 1 changes: protected population up 30 percent, from 240 to 312; comparison population down (250 − 205) / 250 = 18 percent.
Identify the weakness: survey effort in the protected area rose from 20 to 34 observer-days, a 70 percent increase, so part of the apparent rise could be improved detection rather than more birds.
Assess whether the comparison helps: it rules out a general favourable trend, since the unprotected population fell, but it does not address the effort problem because effort rose only in the protected area.
Claim 2 changes: catch down (27,000 − 19,000) / 27,000 ≈ 30 percent; stock up (104,000 − 90,000) / 90,000 ≈ 16 percent.
Assess Claim 2: the stock estimate used the same method throughout, and the catch reduction and stock increase are consistent with the quota's intended mechanism, so the inference is more secure.
Strengthen Claim 1: re-analyse the counts as birds per observer-day, or repeat the protected-area survey at the original effort of 20 observer-days, which separates detection from population change.
Claim 1 reports a 30 percent rise in the protected population against an 18 percent fall in the unprotected comparison, which does rule out a region-wide favourable period — a real strength. Its weakness is that survey effort in the protected area rose from 20 to 34 observer-days, about 70 percent, so some of the increase may be improved detection rather than more birds; the comparison population cannot correct this because its effort was held constant while the protected area's was not. Claim 2 is stronger: catch fell about 30 percent and the estimated stock rose about 16 percent, with the stock estimated by the same method throughout, so the change cannot be attributed to altered measurement and the direction matches the quota's intended mechanism. The most valuable addition to Claim 1 is to express the counts as birds per observer-day, or to repeat the survey at the original 20 observer-days, either of which separates detection effort from population change and would let the 30 percent figure be assessed properly.
Scientific references and adapted source figures
- OpenSciEd 7.5 — ecosystem dynamics and public case graphs
- OpenSciEd middle-school source license — CC BY 4.0
Parent / teacher teaching notes
The survey-effort trap in the application is the most transferable idea in the unit, because it appears whenever a measurement regime changes alongside the thing being measured. Keep the five pressures distinct and then ask which response addresses which, since matching a measure to a pressure is the practical skill. On trade-offs, be explicit that evidence estimates consequences while the weighing of costs is a value judgement — that is both accurate and it keeps the discussion from turning into advocacy. Ask for an explanation of each label, arrow and axis before calculation. Keep first and revised models; attempt the changed case before consulting guidance. Distinguish invented instructional records from named historical sources. Source chromosome symbols are allele-category models, not DNA sequences. These independently authored high-school supplements are not the full OpenSciEd teacher editions or an endorsement.
The key idea
Habitat loss, climate change, pollution, and invasive species are driving a dramatic loss of biodiversity — but conservation (protecting and restoring ecosystems) and sustainability (using resources without exhausting them) can reduce human impact and let ecosystems recover.
Worked examples
Example 1
- Draining the wetland destroys and fragments habitat, so species that depend on it — wading birds, fish and shellfish that use it as a nursery, amphibians — lose their homes and their populations decline locally.
- The remaining natural areas nearby become more isolated, cutting off populations and lowering their genetic diversity, which makes them more vulnerable over time.
- Wetlands also perform valuable ecosystem services: they buffer the coast against storm surge and flooding, filter pollutants from water, and store carbon — services that disappear when the wetland is filled.
Example 2 · Worked application
- Movement evidence supports improved connectivity or corridor use.
- Population recovery requires abundance, survival or reproductive evidence.
- Monitor comparable sites and detection effort.
The success measure must match the conservation goal.
Example 3
- Biomagnification multiplies the concentration by about 10 for each step up the food chain.
- Three trophic levels above the algae means three multiplications: 0.01 × 10 × 10 × 10.
- 0.01 × 10 = 0.1; 0.1 × 10 = 1; 1 × 10 = 10.
Example 4
- Sightings suggest corridor use, but detectability and sampling effort matter.
- Population growth needs independent abundance or reproduction evidence.
Example 5 · Find and fix the mistake
- Test the claim against the stated conditions: The success measure must match the conservation goal.
- Effectiveness requires measured outcomes and consideration of unintended effects.
The success measure must match the conservation goal.
Example 6 · Reason from the visual evidence
- Detection probability is the chance of observing a present organism under a sampling method. A count can rise when effort, access, season or tools change even without equal population growth. An intervention evaluation needs baseline and follow-up measurements with suitable comparison sites and comparable methods. Before–after evidence establishes temporal order but does not alone isolate cause. Several indicators can reveal tradeoffs that one abundance measure hides, including condition, reproduction, habitat quality and unintended effects.
- Detection changed with the intervention period and can increase counts; comparable sampling or modeled correction is needed.
Original hypothetical monitoring-confound record, not actual conservation outcome data.
Avoid these mistakes
- A conservation label is not evidence that every ecological goal has been achieved.
Check your understanding
A wildlife corridor increases sightings but population size is unknown. What can be concluded?
Discuss the answer
Use is plausible; population recovery is not established by sightings alone.
Why should conservation monitoring include multiple indicators?
Discuss the answer
Different indicators can expose changes in reproduction, condition, habitat, detection or unintended effects. One increased count does not establish complete lasting recovery.
Return to the phenomenon
Return to the initial case. Does more wildlife observed after a project prove that the project restored the population? Revise your drawing or explanation using two named ideas and one stated limitation.
Compare explanations after your attempt
Conservation needs matched evidence and explicit priorities; temporal order or one increased indicator does not uniquely establish lasting recovery.
What should we investigate next?
Which comparison would test a remaining uncertainty? State what you would change, keep comparable and measure.
Investigate, explain and revise
Complete these tasks after the teaching parts. Preserve your first model and a supported revision; use guidance after a real attempt.
Activity 1 · Return to the opening case
Use the opening question, defined terms, Parts 1–4 and your notebook. The supplied-data route needs no equipment or external account.
Your task
Return to the initial case. Does more wildlife observed after a project prove that the project restored the population? Revise your drawing or explanation using two named ideas and one stated limitation.
Success criteria
- Use relevant stated observations.
- Explain the mechanism with a labeled model.
- Distinguish quantities and assumptions.
- Describe a revision and a useful next test.
Hint
Follow objects, materials and information separately. Check what each measured quantity means.
Response guidance — discuss after your attempt
Conservation needs matched evidence and explicit priorities; temporal order or one increased indicator does not uniquely establish lasting recovery.
Activity 2 · Transfer to a changed case
Cover the worked guidance and use the unit explanations/figures to solve a changed problem.
Your task
After restoration, observed animals rise from 40 to 60, but survey effort doubles. Explain why a 50% recovery claim is not established and suggest a better evaluation.
Success criteria
- Use the stated measurements or conditions, with correct units.
- Connect the result to the biological mechanism or evidence relationship.
- Identify the assumption, model limit or further evidence requested.
Hint
Name the stated conditions, select the relevant mechanism and show intermediate reasoning.
Response guidance — discuss after your attempt
The raw count rises 50%, but changed detection can contribute. Use comparable effort/methods, suitable reference sites and repeated population/condition indicators; estimate detection where appropriate before attributing recovery.
Words to know
- biodiversity
- The variety of life in an area — the number of different species, the genetic variety within them, and the range of ecosystems they form.
- greenhouse gas
- A gas such as carbon dioxide, methane, or water vapor that absorbs and re-radiates heat, warming the lower atmosphere.
- habitat fragmentation
- The breaking of a large, continuous habitat into smaller, isolated patches, usually by roads, farms, or development.
- invasive species
- A non-native species that spreads rapidly in a new ecosystem because it lacks the predators, diseases, or competitors that limited it back home.
- sustainability
- Using resources in a way that meets present needs without using them up or damaging the environment for future generations.
- conservation
- The careful protection and management of ecosystems, species, and natural resources to prevent their loss.
HIPPO: the threats to biodiversity, ranked
Biologist E. O. Wilson popularized a handy mnemonic for the main drivers of extinction, listed in rough order of impact: Habitat destruction, Invasive species, Pollution, human Population growth, and Overharvesting. Habitat loss tops the list by a wide margin, but the threats rarely act alone — a fragmented forest is more vulnerable to invaders, a warming climate worsens pollution's effects, and a species stressed by one factor is far less able to withstand another. Conservation usually means tackling several HIPPO threats at once.
The ozone hole: a global problem the world actually solved
In the 1980s, scientists discovered that chemicals called CFCs — used in refrigerators and spray cans — were tearing a hole in the ozone layer that shields life from harmful ultraviolet radiation. The response was remarkably fast: nearly every nation signed the 1987 Montreal Protocol to phase CFCs out, and the ozone layer is now slowly healing, on track to recover within decades. It stands as proof that coordinated global action on an environmental threat is not just possible but can genuinely work.
Wolves that reshaped a landscape — and its rivers
When gray wolves were reintroduced to Yellowstone National Park in 1995 after a 70-year absence, they did far more than hunt elk. With wolves back, elk avoided lingering in open valleys, so willows and aspen recovered along the streams; beavers returned to the new growth, songbirds followed, and stabilized banks even changed how some rivers flowed. This chain of effects rippling down from a top predator is called a trophic cascade, and it's a vivid demonstration of how a single keystone species can hold an entire ecosystem together.
Extinction is natural — the rate is not
A common objection is that 'extinction happens naturally, so why worry?' It's true that species have always gone extinct at a slow background rate. But today species are vanishing an estimated 100 to 1,000 times faster than that natural pace, and the losses are driven by human activity rather than by asteroids or ice ages. That combination — an extreme rate plus a single dominant cause — is exactly why scientists describe the current crisis as a human-caused sixth mass extinction, not business as usual.
Feedback loops: why early action matters
Climate change is worrying partly because of positive feedback loops that can amplify it. As bright ice melts, it exposes dark water and land that absorb more sunlight, causing more warming and more melting. Thawing Arctic permafrost releases methane, a potent greenhouse gas, which drives still more warming. These self-reinforcing loops mean the system can shift faster the longer we wait, which is why reducing emissions sooner — through renewable energy, protecting carbon-storing forests, and cutting waste — has an outsized payoff compared with acting later.
In the real world
After the pesticide DDT was banned in the United States in 1972 — once biomagnification was shown to be thinning the eggshells of top predators — bald eagle, osprey, and peregrine falcon populations rebounded dramatically, a landmark example of conservation science reversing human damage.
Exit check
Why does a pollutant not automatically biomagnify just because it enters a food web?
Check your explanation after answering
Persistence, uptake, metabolism, excretion, and feeding pathways determine concentration patterns. Biomagnification is substance- and context-dependent, not universal.
Explain your reasoning without notes. If a key idea is missing, revisit the lesson and try again.