Reading Weather Patterns — Print · Grade 9 Science
Chapter: Atmosphere & WeatherReading Weather Patterns
Learning goals
- I can identify H, L, fronts, isobars, and station models on a weather map.
- I can use a barometric pressure trend to predict whether weather will improve or worsen.
- I can explain why weather in the mid-latitudes, including New York, generally moves from west to east.
Readings for this unit
Before this unit
Read graphs with timestamps, units and changing conditions.
Plan three teaching sessions: core explanation and Parts 1–2; Parts 3–4 with diagrams and reasoning checks; then the whole-unit application, worked examples, independent practice, and exit check. Read one part at a time, explain it without notes, and revisit any gap. Allow about 40–50 minutes per session; adjust after checking understanding. Trace and explain the labeled figures in each part. In the third session, complete the illustrated case and changed independent application; retain a corrected explanation rather than only an answer.
Start with something to explain
What makes a forecast specific enough to test?
Illustrative evidence case. Two supplied models agree a front is approaching but give different speeds. Later rain measurements can be compared with a forecast made for a stated window.
Notice and wonder
Record two observations using the stated quantities or relationships. Keep observations separate from possible causes. Write one question that a new measurement could help answer.
What makes a forecast specific enough to test?
Your first model
Draw the moving boundary and record a predicted measurable event, place and interval before viewing later records.
Build the language from the idea
- isobar
- A line on a weather map connecting points that all have the same air pressure; closely packed isobars mean stronger winds.
- station model
- A small cluster of symbols and numbers on a weather map that packs in one location's temperature, wind, and cloud cover at a glance.
- meteorologist
- A scientist who studies the atmosphere and uses weather data to make forecasts.
- prevailing westerlies
- The belt of winds in the mid-latitudes, including New York, that generally blows from west to east, steering most weather systems that way.
- relative humidity
- A ratio comparing actual vapor conditions with the saturation reference at the current conditions, normally expressed as a percent.
- dew point
- The temperature associated with saturation for the moisture present under the stated pressure conditions.
A weather map can look like a tangle of lines and symbols until you know the code, and then it turns into a readable picture of the sky. Meteorologists — the scientists who study the atmosphere and forecast its behavior — mark centers of high and low pressure with a bold H or L, draw fronts as lines studded with triangles (cold) or semicircles (warm), and connect all the places that share the same air pressure using curving lines called isobars.
Those isobars do more than label pressure — their spacing reveals the wind. Where isobars are packed tightly together, pressure is changing sharply over a short distance, and that steep 'pressure hill' drives strong winds, just as a steeper slope makes a ball roll faster. Where the isobars spread far apart, the pressure change is gentle and the air stays calm. So without a single wind measurement, one glance at how crowded the isobars are tells a forecaster where it's blowing hardest.
To pack even more into one spot on the map, meteorologists use a station model — a compact cluster of symbols and numbers that reports one location's temperature, wind speed and direction, cloud cover, and more, all at a glance. Behind those tidy symbols stands a small army of instruments: a thermometer for temperature, a barometer for pressure, an anemometer for wind speed, a hygrometer for humidity, and a rain gauge for precipitation, backed up by Doppler radar and satellites watching storms from above.
Here's the pattern forecasters in New York lean on every single day: in the mid-latitudes, weather generally marches from west to east, carried along by a broad belt of winds called the prevailing westerlies and by the fast, high-altitude river of air known as the jet stream. Because of this, a meteorologist can look at what's soaking Ohio today and make a solid prediction about what Westchester County will get tomorrow. Weather doesn't teleport — it travels, and here it mostly travels one direction, which is what makes short-range forecasting possible at all.
The other half of forecasting is watching how things change over time, and pressure is the giveaway. If the barometer has been falling steadily for a few hours, air is rising, clouds are building, and a storm is probably on the way; if it's been climbing, sinking air is clearing the skies. Combine the two habits — reading what's happening upwind and tracking whether the pressure is rising or falling — and you can do exactly what professional forecasters do: turn a snapshot of right now into a reliable guess about tomorrow.
Weather describes short-term atmospheric conditions; a forecast estimates how those conditions may develop. A station measurement is local, while radar and satellite observations cover wider areas. Compare their different strengths before combining them.
Read a weather map as a snapshot with a stated observation time. A pressure trend or moving front needs several maps to establish motion. Missing data and model simplifications limit predictions, especially over longer intervals.
A forecast expressed as probability does not promise the same result everywhere. Evaluate forecasts over many events rather than one memorable success or failure. Record what happened, the location and time interval, then compare with what was actually predicted.
Build your understanding
Plan three teaching sessions: core explanation and Parts 1–2; Parts 3–4 with diagrams and reasoning checks; then the whole-unit application, worked examples, independent practice, and exit check. Read one part at a time, explain it without notes, and revisit any gap. Allow about 40–50 minutes per session; adjust after checking understanding.
Part 1 · Decode a weather map before forecasting
A station model places weather measurements around a station location using a stated convention. Temperature and dew point are different quantities: dew point is associated with saturation for the moisture present. The wind shaft extends toward the direction the wind comes from; barbs encode speed in the map’s stated units. Pressure may be coded on a reference map, so use its decoding rule rather than inventing missing digits. Here the pressure is already written in full. Each full wind barb represents 10 knots, so the two full barbs give 20 knots; one knot is one nautical mile per hour, about 1.852 km/h. The observation time, location and key are part of the data, because weather evolves.
Read the visual model
Read the numbers as explicitly decoded temperature, dew point and pressure. The two full barbs are only interpretable with the stated wind-speed convention.
Why must the time stamp and decoding key accompany a station symbol before comparing forecasts?
Visual reasoning — after your attempt
They establish when observations apply and how symbols/units are interpreted. A later forecast cannot be checked fairly against an unspecified time or invented code convention.
Read the key, units, time stamp and spatial scale. A station model compresses temperature, dew point, pressure, wind and other observations into symbols. Use the provided decoding convention for pressure rather than inventing missing digits. A map represents observations or analyses for a particular time, not every later condition.
Two maps six hours apart allow a movement comparison only if their definitions and scales are compatible. Mark what is observed and what is an interpreted boundary.
Pause and explain
Why is the observation time essential for a forecast comparison?
Check your reasoning after answering
Weather changes; evidence from different times must be ordered to infer movement and development.
Part 2 · Connect humidity, cooling and cloud formation
Relative humidity compares the actual water-vapor amount or vapor pressure with the saturation reference under the current conditions. In the supplied fixed-volume model, 8 units compared with a warm saturation reference of 16 give 50% RH; the same 8 units compared with a cooler reference of 8 give 100%. Cooling changes the reference relationship, not a literal container that becomes full. Continued cooling under suitable conditions can lead to condensation. Actual saturation values and volume/pressure changes need the appropriate reference data; these invented units teach the ratio rather than a universal temperature table.
Read the visual model
Keep actual vapor at 8 while changing the saturation reference. Compare like quantities within the same fixed-volume model.
Why does equal relative humidity at two different temperatures not guarantee equal vapor amount?
Visual reasoning — after your attempt
Their saturation reference can differ. Equal fractions of different reference amounts can correspond to different actual vapor amounts.
Relative humidity relates actual vapor to the saturation value under current conditions. Cooling can raise relative humidity without adding vapor. Dew point identifies a temperature associated with saturation for the moisture present. Cloud formation depends on cooling/lift and condensation conditions, not a literal container of air becoming full.
Air cooled toward its dew point can condense vapor into droplets. Two samples with equal relative humidity can have different vapor amounts if their temperatures differ.
Pause and explain
Does equal relative humidity imply equal water-vapor amount at different temperatures?
Check your reasoning after answering
No. The saturation reference depends on temperature.
Part 3 · Extract trends and evaluate uncertainty
Forecast models use initial observations and mathematical process descriptions to evolve a represented system. Different initial estimates or model approximations can yield different movement speeds even when both suggest front passage. A location 120 km ahead would be reached after 3 h at 40 km/h or 4 h at 30 km/h in this constant-speed model. The agreement supports the broad event, while the disagreement identifies timing uncertainty. Check newer observations, front evolution and model performance rather than treating one line as a guaranteed appointment.
Read the visual model
The curves share an initial position and direction but differ in slope. The vertical axis is travel distance, not temperature or precipitation probability.
At a place 60 km ahead, what arrival times do the two supplied models imply?
Visual reasoning — after your attempt
1.5 h at 40 km/h and 2 h at 30 km/h, assuming steady speed along the stated path. Actual movement can evolve.
A falling pressure trend, changing wind and approaching front together can support a forecast. Numerical models evolve a representation from initial observations; incomplete measurements and approximations create uncertainty. Compare multiple indicators and distinguish an expected outcome from a guarantee.
If model runs disagree about a front’s speed, arrival timing has uncertainty even when all suggest passage. Report a reasonable range supported by the runs, not an exact minute chosen for convenience.
Pause and explain
What does agreement on front passage but disagreement on speed imply?
Check your reasoning after answering
The event may be supported while its timing remains uncertain.
Part 4 · Test a forecast against later observations
Verification compares a forecast made in advance with later observations for its stated location, time window and variable. If the original forecast was 4 mm of rain and 2 mm occurred, it overestimated by 2 mm for that window. An updated forecast for another interval is a new prediction, not evidence that the original one was correct. Multiple events can reveal average error and variability; one successful or unsuccessful case does not establish universal model skill. Keep the original criteria and compare alternatives on matched windows and measurements.
Read the visual model
The first two bars share a verification window. The update is shown as a distinct forecast, not a replacement for the archived original.
Why would comparing the original six-hour forecast with a later twelve-hour accumulation be unfair?
Visual reasoning — after your attempt
The intervals differ, so they measure different outcomes. Verify the stated six-hour window with matching observations before assessing or comparing skill.
State the forecast, location, interval and measurable outcome before checking it. Compare temperature, precipitation or timing with the prediction; a successful broad claim can still miss an important detail. Repeated verification helps identify patterns of model error and whether an update improves performance.
Forecasting some rain tomorrow is different from forecasting more than 20 mm between two stated hours. Decide which criterion was actually promised before scoring the result.
Pause and explain
Why should forecast verification use the original stated criterion?
Check your reasoning after answering
Changing the criterion afterward can make an incorrect or vague prediction appear successful.
Apply the whole unit · A forecast and verification notebook
Illustrative forecast: frontal passage between 14:00 and 18:00, temperature falls at least 5 °C. Observed passage is 17:00 and temperature falls from 24 to 16 °C.
Your task
Evaluate timing and temperature separately, show the change, and explain why one successful case does not establish universal reliability.
What your response should show
- Use the supplied evidence accurately and label units or locations.
- Explain a physical mechanism or evidence-to-claim relationship.
- Show calculations or a clearly labeled model when the task calls for one.
- Identify a meaningful assumption, uncertainty, or competing explanation.
Response guidance — after your attempt
17:00 falls within the window; cooling is 8 °C, exceeding the threshold. Both stated criteria are met. Repeated cases, other variables and different conditions are needed to characterize accuracy; retain what was predicted before observing the result.
Scientific references and adapted source material
Parent / teacher teaching notes
Use a short observation log or the supplied case. Ask for decoding, physical mechanism and verification separately so symbol reading is not mistaken for forecasting understanding. Ask the learner to explain each visual label and causal step before calculating. Preserve a first model, attempt the changed independent case, then use feedback to revise. Diagrams state whether values are illustrative or observed. Selected OpenSciEd excerpts are middle-school source material used for supported foundations; the independent high-school explanations and supplements are not the complete OpenSciEd teacher editions or an endorsement.
The key idea
Weather maps use H, L, fronts, and isobars to show pressure patterns; because mid-latitude weather generally moves west to east, watching pressure trends and what's happening upwind predicts what's coming next.
Pressure Change Rate
rate = ΔP ÷ Δt
ΔP is the change in barometric pressure (mb) and Δt is the elapsed time (hours); a fast, large drop often signals a stronger storm approaching.
Worked examples
Example 1
- Falling pressure means the air above that location is rising rather than sinking.
- Rising air cools as it climbs, and cooling air causes water vapor to condense into clouds.
- More clouds and rising air together typically lead to an increasing chance of precipitation, so conditions are likely to turn cloudier and stormier.
Example 2 · Worked application
- Several observations support an approaching disturbed-weather system.
- Check radar, fronts and updated forecasts before predicting exact timing or severity.
A forecast is conditional and updated with new evidence.
Example 3
- In the mid-latitudes, including New York, weather systems are generally steered by the prevailing westerlies from west to east.
- A storm 500 miles to the west is roughly upwind of Westchester County in that general flow.
- Since systems typically take a day or two to travel that distance, Westchester should likely prepare for that storm within the next day or so.
Example 4
- Average speed=180/6=30 km/h.
- Future speed or direction can change, so straight extrapolation is an assumption.
Example 5 · Find and fix the mistake
- Test the claim against the stated conditions: A forecast is conditional and updated with new evidence.
- Weather is short-term; climate concerns distributions over long periods.
A forecast is conditional and updated with new evidence.
Example 6 · Reason from the visual evidence
- The curves share an initial position and direction but differ in slope. The vertical axis is travel distance, not temperature or precipitation probability.
- 1.5 h at 40 km/h and 2 h at 30 km/h, assuming steady speed along the stated path. Actual movement can evolve.
Original illustrative constant-speed front trajectories for timing comparison. They are not an operational forecast ensemble or a calibrated probability interval. The record distinguishes event agreement from uncertainty about timing.
Avoid these mistakes
- One weather map cannot by itself establish a front's speed or direction over time.
Check your understanding
A front moves 180 km between maps taken 6 h apart. Find its average speed and one forecasting limit.
Discuss the answer
30 km/h over the measured interval; a later arrival estimate needs continued observations.
Why should forecasts be evaluated across many events?
Discuss the answer
Repeated matched-event verification reveals systematic error, variability and skill under different conditions. One successful event can reflect chance or a limited condition and does not establish universal forecast performance.
Return to the phenomenon
Return to the initial case. What makes a forecast specific enough to test? Revise your drawing or explanation using two named ideas and one stated limitation.
Compare explanations after your attempt
Keys and time stamps make map observations interpretable. Model timing can differ, and fair verification uses the archived prediction and a matching observed variable/window rather than a broad claim that weather changed.
What should we investigate next?
Which comparison would test a remaining uncertainty? State what you would change, keep comparable and measure.
Investigate, explain and revise
Complete the tasks after studying the visual parts. Keep the first model and explain a revision before consulting the guidance.
Activity 1 · Explain the opening case
Use this unit’s opening record, Parts 1–4 and your notebook model. No external equipment or text is required for this supplied-data route.
Your task
Return to the initial case. What makes a forecast specific enough to test? Revise your drawing or explanation using two named ideas and one stated limitation.
Success criteria
- Use two stated observations or conditions.
- Connect the mechanism to a labeled diagram or calculation.
- Identify what your original model missed.
- State a useful further test and a limitation.
Hint
Name the quantities and interactions before assigning a cause.
Response guidance — discuss after your attempt
Keys and time stamps make map observations interpretable. Model timing can differ, and fair verification uses the archived prediction and a matching observed variable/window rather than a broad claim that weather changed.
Activity 2 · Transfer to a changed case
Use the figures, captions and vocabulary in this unit; cover the worked answer.
Your task
A front is 90 km from a town. Model A gives steady motion 30 km/h and model B 45 km/h. Calculate the two arrival times and define a fair observation-based timing check.
Success criteria
- Use the stated measurements or conditions, with correct units.
- Connect the result to the physical mechanism or evidence relationship.
- Identify the assumption, model limit or further evidence requested.
Hint
Separate measured values, calculated results and model assumptions.
Response guidance — discuss after your attempt
A gives 3 h and B 2 h. Record the forecast issue time, defined passage indicator/location and predicted intervals, then compare with later observations using the original criteria. Changing criteria after the event undermines verification.
Activity 3 · Interpret an actual station record
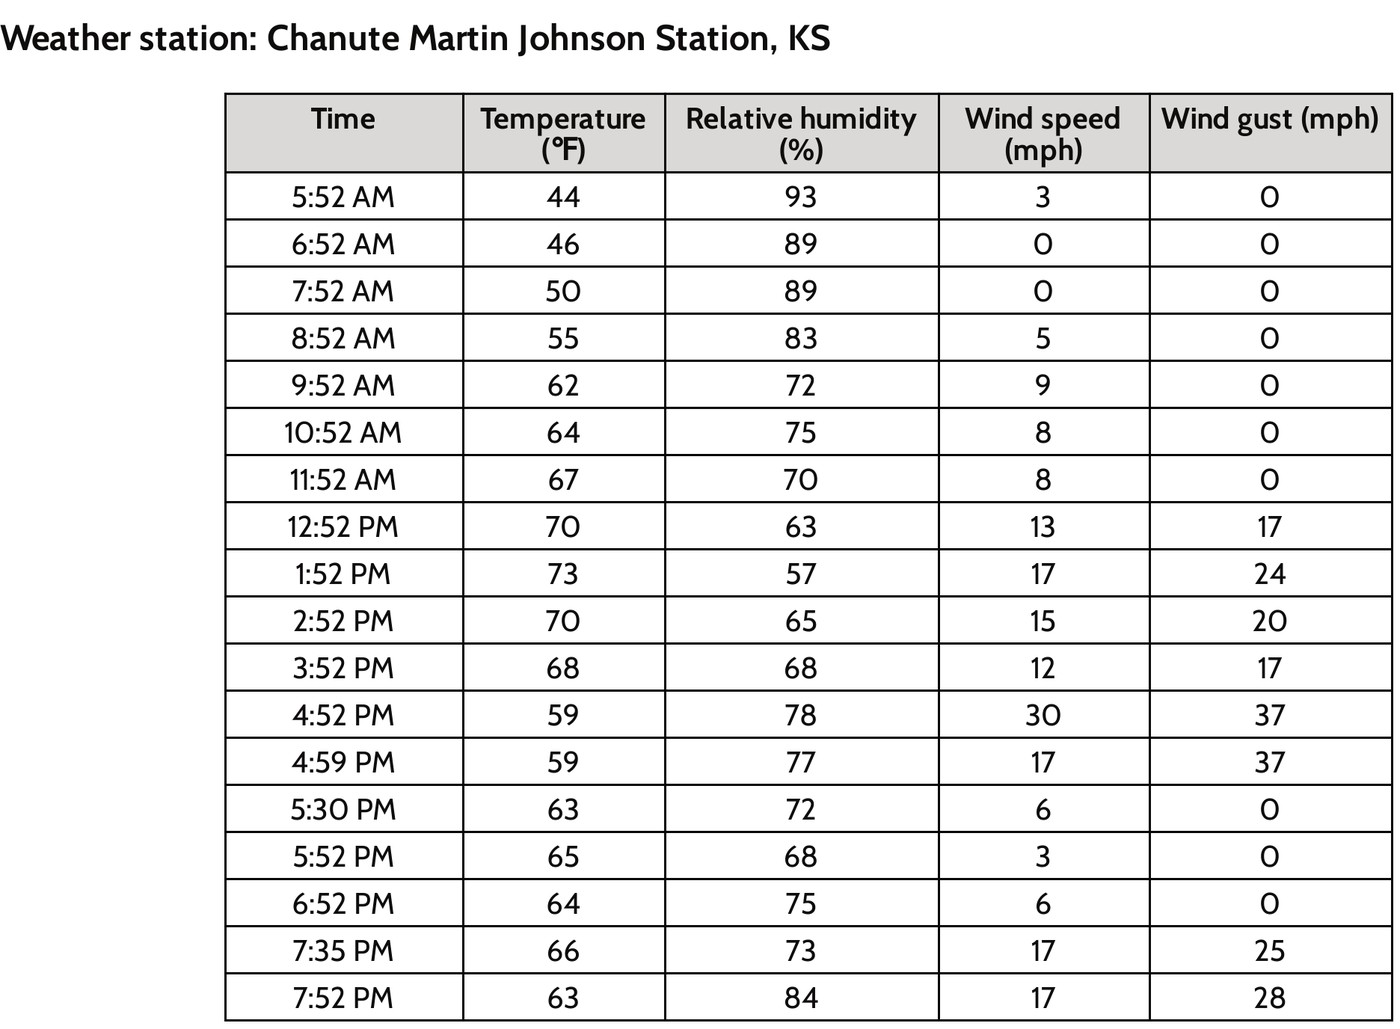
Use the credited historical OpenSciEd station table in Part 3 and the source-evidence practice question.
Your task
Using the actual station record, calculate the changes from 3:52 PM to 4:52 PM in temperature (°F and °C), relative humidity (percentage points) and wind speed (mph). For a temperature difference, Δ°C = Δ°F × 5/9. Explain what these simultaneous changes support and why they do not by themselves prove a particular front, exact hailfall location or complete cause.
Success criteria
- All changes use later minus earlier and retain correct units.
- Temperature-difference conversion and percentage-point distinction are correct.
- The inference is limited to the stated record and identifies evidence needed for a causal explanation.
Hint
Keep the original source units and compare the same columns. For a temperature change, only the scale factor 5/9 is needed.
Response guidance — discuss after your attempt
Temperature changes from 68 to 59 °F: −9 °F, equivalent to −5 °C. Relative humidity changes from 68% to 78%: +10 percentage points, not a 10% relative increase. Wind speed changes from 12 to 30 mph: +18 mph. The observations support a changing atmospheric situation at the named station; mapped front/pressure, wind direction, moisture and event-location evidence would help test causes. A humidity increase alone does not prove more water vapor, because saturation conditions change with temperature.
Words to know
- isobar
- A line on a weather map connecting points that all have the same air pressure; closely packed isobars mean stronger winds.
- station model
- A small cluster of symbols and numbers on a weather map that packs in one location's temperature, wind, and cloud cover at a glance.
- meteorologist
- A scientist who studies the atmosphere and uses weather data to make forecasts.
- prevailing westerlies
- The belt of winds in the mid-latitudes, including New York, that generally blows from west to east, steering most weather systems that way.
- relative humidity
- A ratio comparing actual vapor conditions with the saturation reference at the current conditions, normally expressed as a percent.
- dew point
- The temperature associated with saturation for the moisture present under the stated pressure conditions.
The jet stream: a river of air that steers — and sometimes 'gets stuck'
High above the surface, a fast-moving ribbon of air called the jet stream forms where cold polar air meets warmer air to the south, and it's the real engine behind the 'west to east' movement of mid-latitude weather. The jet stream doesn't flow in a straight line — it bends into large, wavy loops called Rossby waves. When these waves get unusually large and slow down, a weather pattern can get essentially 'stuck' in place for days or weeks, called a blocking pattern, which is often the underlying cause of unusually long heat waves or extended cold snaps.
From storm proverbs to supercomputers — and why forecasts still fail
Before the telegraph, weather warnings could only travel as fast as the storm itself, so 'forecasting' relied mostly on folklore and local sky-watching. Starting in the 1870s, telegraph networks let observers report conditions upwind instantly, creating the first real storm warning systems. Today's forecasts come from supercomputers running numerical models based on physics equations — but meteorologist Edward Lorenz discovered in the 1960s that the atmosphere is a chaotic system, where a tiny, unmeasurable difference in starting conditions (his famous 'butterfly effect') can snowball into wildly different outcomes, which is exactly why forecasts reliably get less accurate the farther out they predict.
How Doppler radar 'sees' a tornado forming
Weather radar doesn't just show where rain is falling — modern Doppler radar measures the Doppler shift in the radio waves it bounces off raindrops, revealing whether that precipitation (and the air carrying it) is moving toward or away from the radar station, and how fast. By detecting a tight, tornado-shaped pattern of air rotating rapidly in opposite directions right next to each other inside a storm, meteorologists can issue a tornado warning even before a funnel cloud is ever visually spotted, buying critical extra minutes for people to take shelter.
A twice-a-day balloon launch, all over the planet
Every single day, at almost exactly the same two moments (routinely near midnight and noon Greenwich time), roughly 900 weather stations across the globe simultaneously release radiosonde balloons — instrument packages that radio back temperature, humidity, pressure, and wind data as they rise through the entire atmosphere. This coordinated, worldwide snapshot, repeated twice daily for decades, is one of the main real-world data sources meteorologists feed into the computer models used to build the station models and pressure maps described in this lesson.
In the real world
Airline pilots, farmers deciding when to harvest, and weekend campers all check the same station-model-packed weather maps to plan around what's coming.
Exit check
How could falling pressure and observations west of New York help a forecast?
Check your explanation after answering
Falling pressure may signal an approaching system. Many regional systems move generally west to east, so upstream observations can help predict changes. Wind, moisture, fronts, and local conditions are also needed; the pattern is not a guarantee.
Explain your reasoning without notes. If a key idea is missing, revisit the lesson and try again.
Problem 1
- Isobar
- Isotherm
- Front
- Station model
Answer and explanation
Isobar
Isobars connect points of equal air pressure — 'iso' means equal and 'bar' refers to pressure.
Problem 2
- Barometer
- Anemometer
- Hygrometer
- Rain gauge
Answer and explanation
Barometer
A barometer measures air pressure; an anemometer measures wind speed, a hygrometer measures humidity, and a rain gauge measures precipitation.
Problem 3
- From west to east
- From east to west
- From north to south only
- Randomly, with no general pattern
Answer and explanation
From west to east
The prevailing westerlies and the jet stream generally steer mid-latitude weather from west to east.
Problem 4
- Strong winds, due to a big pressure difference over a short distance
- Calm winds, because the pressure is very steady
- An approaching heat wave with no wind
- That the map has an error
Answer and explanation
Strong winds, due to a big pressure difference over a short distance
Tightly packed isobars mean pressure changes quickly over a short distance, and bigger pressure differences drive stronger winds.
Problem 5
Answer and explanation
18 mb
1020 − 1002 = 18 mb. That's a fairly rapid fall, often a sign that stormier weather is on the way.
Problem 6
Answer and explanation
30 km/h over the measured interval; a later arrival estimate needs continued observations.
Average speed=180/6=30 km/h.
Future speed or direction can change, so straight extrapolation is an assumption.
Response criteria
- Use the stated conditions.
- Show the evidence or calculation.
- Explain the conclusion and any stated limitation.
Problem 7
Hints
A forecast is conditional and updated with new evidence.
Answer and explanation
Distance to the location and movement speed/direction over successive images, with allowance for growth or decay.
Problem 8
Hints
State what the supplied observations or conditions establish, and separate that from any assumption.
Answer and explanation
Initial-state uncertainty and evolving interactions can amplify differences in predictions.
Problem 9
Answer and explanation
1.5 h at 40 km/h and 2 h at 30 km/h, assuming steady speed along the stated path. Actual movement can evolve.
The curves share an initial position and direction but differ in slope. The vertical axis is travel distance, not temperature or precipitation probability.
1.5 h at 40 km/h and 2 h at 30 km/h, assuming steady speed along the stated path. Actual movement can evolve.
Response criteria
- Read the labeled quantities, reference frame or objects correctly.
- Explain the relation between the visual evidence and the mechanism.
- Keep the drawing’s stated assumptions and limits in the conclusion.
Problem 10
Answer and explanation
A gives 3 h and B 2 h. Record the forecast issue time, defined passage indicator/location and predicted intervals, then compare with later observations using the original criteria. Changing criteria after the event undermines verification.
A gives 3 h and B 2 h. Record the forecast issue time, defined passage indicator/location and predicted intervals, then compare with later observations using the original criteria. Changing criteria after the event undermines verification.
Response criteria
- Use the stated measurements or conditions, with correct units.
- Connect the result to the physical mechanism or evidence relationship.
- Identify the assumption, model limit or further evidence requested.
Problem 11
Answer and explanation
Temperature changes from 68 to 59 °F: −9 °F, equivalent to −5 °C. Relative humidity changes from 68% to 78%: +10 percentage points, not a 10% relative increase. Wind speed changes from 12 to 30 mph: +18 mph. The observations support a changing atmospheric situation at the named station; mapped front/pressure, wind direction, moisture and event-location evidence would help test causes. A humidity increase alone does not prove more water vapor, because saturation conditions change with temperature.
Read matching times and the correct source columns before subtracting.
Subtract later minus earlier: 59−68 = −9 °F; multiply the difference by 5/9 to obtain −5 °C. Do not subtract 32 when converting a temperature difference.
Compute 78−68 = 10 percentage points and 30−12 = 18 mph; gusts are a separate column.
State the station scale and time interval, then request independent mapped/process evidence rather than claim a unique cause.
Response criteria
- All changes use later minus earlier and retain correct units.
- Temperature-difference conversion and percentage-point distinction are correct.
- The inference is limited to the stated record and identifies evidence needed for a causal explanation.