Air Masses, Fronts & Pressure — Print · Grade 9 Science
Chapter: Atmosphere & WeatherAir Masses, Fronts & Pressure
Learning goals
- I can classify an air mass by where it formed, using the terms continental, maritime, polar, and tropical.
- I can compare how cold fronts and warm fronts differ in speed and the weather they bring.
- I can relate high and low air pressure to sinking/rising air and fair/stormy weather.
Readings for this unit
Before this unit
Read pressure maps and distinguish air-mass temperature from moisture.
Plan three teaching sessions: core explanation and Parts 1–2; Parts 3–4 with diagrams and reasoning checks; then the whole-unit application, worked examples, independent practice, and exit check. Read one part at a time, explain it without notes, and revisit any gap. Allow about 40–50 minutes per session; adjust after checking understanding. Trace and explain the labeled figures in each part. In the third session, complete the illustrated case and changed independent application; retain a corrected explanation rather than only an answer.
Start with something to explain
Why does a passing front change more than temperature?
Illustrative evidence case. A supplied station sequence includes falling then rising pressure, a temperature drop, a wind shift and showers ending.
Notice and wonder
Record two observations using the stated quantities or relationships. Keep observations separate from possible causes. Write one question that a new measurement could help answer.
Why does a passing front change more than temperature?
Your first model
Sketch source air masses, the boundary, lifting and expected observation sequence.
Build the language from the idea
- air mass
- A huge body of air that takes on a fairly uniform temperature and humidity from the surface it sits over for days at a time.
- front
- The boundary where two different air masses meet — usually the setting for a region's most active weather.
- air pressure
- The weight of the air pressing down on a given area, measured with a barometer.
- barometer
- An instrument that measures air pressure, useful for tracking whether weather is likely to clear or worsen.
Step outside and the air you feel might belong to a single enormous air mass — a body of atmosphere often hundreds of miles across that has parked over one kind of surface long enough to take on its temperature and moisture, becoming fairly uniform throughout. Meteorologists label each air mass with two letters that tell you where it was born. The first, lowercase letter gives its moisture: continental (c) forms over land and stays dry, while maritime (m) forms over the ocean and stays moist. The second, capital letter gives its temperature: polar (P) is cold, tropical (T) is warm. Snap them together and you can read an air mass at a glance — a continental polar (cP) mass forming over frozen northern Canada is cold and dry, while a maritime tropical (mT) mass forming over the Gulf of Mexico is warm and soggy.
The real drama happens where two air masses meet but refuse to blend, along a boundary called a front. A cold front forms when a cold, dense air mass comes charging in and shoves under a warmer one, forcing that warm air to rise steeply and fast — like a snowplow scooping air upward. Because the boundary is steep and moves quickly, the rising warm air's moisture condenses in a hurry, so cold fronts tend to deliver a short, punchy burst of weather: gusty winds and heavy rain or thunderstorms, followed by rapid clearing into noticeably cooler, fresher air.
A warm front is the mirror image, and it takes its time. Here warm air slides slowly up and over a retreating wedge of cold air along a long, gentle ramp, so instead of a sudden storm it announces itself hours ahead with clouds that gradually lower and thicken, followed by a long stretch of light, steady rain or snow before the warmer air finally arrives. When a speedy cold front catches up to a plodding warm front and lifts it off the ground, the two combine into an occluded front; a boundary that stalls and just sits in place is a stationary front.
Fronts don't wander on their own — they're steered by patterns of air pressure, the weight of the atmosphere pressing down on a given spot, which we measure with a barometer. Air pressure changes because air is always either sinking or rising somewhere. Where air is sinking, it piles up and presses down harder, creating high pressure; that sinking, drying air usually brings clear, calm, fair weather. Where air is rising, it leaves less atmosphere pressing down, creating low pressure; the rising air cools, its moisture condenses, and clouds and storms tend to follow.
This is also what makes the wind blow. Air always rushes from areas of higher pressure toward areas of lower pressure, trying to even out the difference — and the bigger the pressure gap, the stronger the wind. That's why storms organize themselves around low-pressure centers: air spirals inward and upward toward the low, feeding the very clouds and rain that define bad weather. Put it all together and a weather map starts to read like a story — high-pressure zones promising calm, low-pressure centers trailing their fronts, and the wind telling you which way it's all about to move.
An air mass develops characteristic temperature and moisture over a source region. When air masses meet, a front can lift air and change weather. The type and timing depend on motion and conditions rather than the front's name alone.
Pressure differences drive horizontal air movement, modified by rotation, friction and terrain. Isobars show equal pressure, and closer spacing generally indicates a stronger pressure gradient. Read units and map time before comparing patterns.
Rising moist air cools and may form clouds or precipitation. High and low pressure are useful patterns but not guarantees of clear sky or storms at every location. Use pressure, wind, moisture and temperature observations together to make a forecast.
Build your understanding
Plan three teaching sessions: core explanation and Parts 1–2; Parts 3–4 with diagrams and reasoning checks; then the whole-unit application, worked examples, independent practice, and exit check. Read one part at a time, explain it without notes, and revisit any gap. Allow about 40–50 minutes per session; adjust after checking understanding.
Part 1 · Identify air masses by source conditions
An air mass is a broad air region with relatively similar temperature and moisture properties. Continental refers to a land source and maritime to a water source; polar and tropical describe broad thermal source settings. These terms summarize initial tendencies rather than a fixed temperature or humidity at every point. As air moves across warmer water, mountains or other regions, surface exchanges, lifting and mixing can modify it. A source label therefore contributes to weather reasoning but does not replace current observations or a trajectory model.
Read the visual model
Compare the supplied source conditions, then consider what the air travels over after leaving them. The panels are settings, not mapped present air masses.
Why could a continental-polar air mass become moister after moving across a large lake?
Visual reasoning — after your attempt
Surface evaporation and mixing can add water vapor under suitable conditions, changing moisture properties while the original source label remains useful historical context.
An air mass has relatively similar temperature and moisture characteristics over a large area. Its source region helps shape those properties, but movement modifies them. Continental/maritime and polar/tropical labels are a useful first description, not exact local temperature or humidity predictions for every point.
A maritime air mass moving over land can change through heating, cooling and moisture exchanges. Track its history rather than assume that its initial label stays perfectly unchanged.
Pause and explain
Why can an air mass change after leaving its source region?
Check your reasoning after answering
It exchanges energy and moisture with the surfaces and air encountered along its path.
Part 2 · Use pressure patterns to explain wind
An isobar connects locations with equal air pressure in a map analysis. The pressure-gradient force acts toward lower pressure, perpendicular to local isobars. For the same isobar interval and map scale, tighter spacing indicates a larger pressure change over distance. Earth’s rotation and surface friction modify actual wind direction, so a single straight arrow from H to L is incomplete. Pressure in hectopascals uses 1 hPa = 100 Pa. Always read the interval: two closely drawn 1 hPa lines need not indicate a larger gradient than farther-apart 8 hPa lines.
Read the visual model
Read the nested pressure labels and the inward selected force arrow. The red arrow is a pressure-gradient force, not a complete surface-wind forecast.
Why can isobar spacing not be compared fairly between maps with different pressure intervals?
Visual reasoning — after your attempt
Gradient is pressure change per distance. Both interval and ground scale must be checked; spacing alone does not provide the same pressure change.
A pressure-gradient force points from higher toward lower pressure. Earth’s rotation and surface friction modify the wind direction, so real wind does not generally travel straight from an H symbol to an L symbol. Isobar spacing can indicate gradient strength when interval and scale are comparable.
Closer isobars at the same scale and interval represent a stronger gradient. Compare actual pressure differences and distance instead of judging a map with different contour intervals by appearance alone.
Pause and explain
Why must isobar interval be checked before comparing spacing?
Check your reasoning after answering
A different interval changes the pressure difference represented by each space.
Part 3 · Connect frontal geometry with uplift
A front separates contrasting air masses and can provide lifting. At a cold front, advancing denser cool air often undercuts warmer air; at a warm front, advancing warmer air commonly rises over a cooler wedge with a gentler typical slope. Rising air can expand and cool, allowing condensation under suitable moisture conditions. Stability concerns whether a displaced parcel tends to keep moving or return relative to its surroundings. Moisture, stability and front motion therefore influence cloud/precipitation patterns; the boundary alone does not guarantee identical rain everywhere.
Read the visual model
Trace the cool-air advance separately from the warmer-air uplift. The sloping boundary is a schematic cold front, not an identical geometry for every front.
Why does the lifting shown here not prove that every location along the front must have the same precipitation?
Visual reasoning — after your attempt
Available moisture, stability, local flow and timing vary. Lifting supplies a process, while those conditions influence whether and how precipitation develops.
A front separates contrasting air masses. A cold front often has advancing cooler air undercutting warmer air; a warm front commonly has advancing warm air rising over cooler air. Lift and moisture can support cloud and precipitation, but the outcome depends on stability, moisture and movement.
The triangles or semicircles on a surface map identify front type and indicate its conventional movement direction. They do not show the exact vertical slope or guarantee rain at every point along it.
Pause and explain
Why does a front not guarantee identical precipitation everywhere?
Check your reasoning after answering
Moisture, stability, lifting strength and local conditions vary along the boundary.
Part 4 · Combine evidence across a weather passage
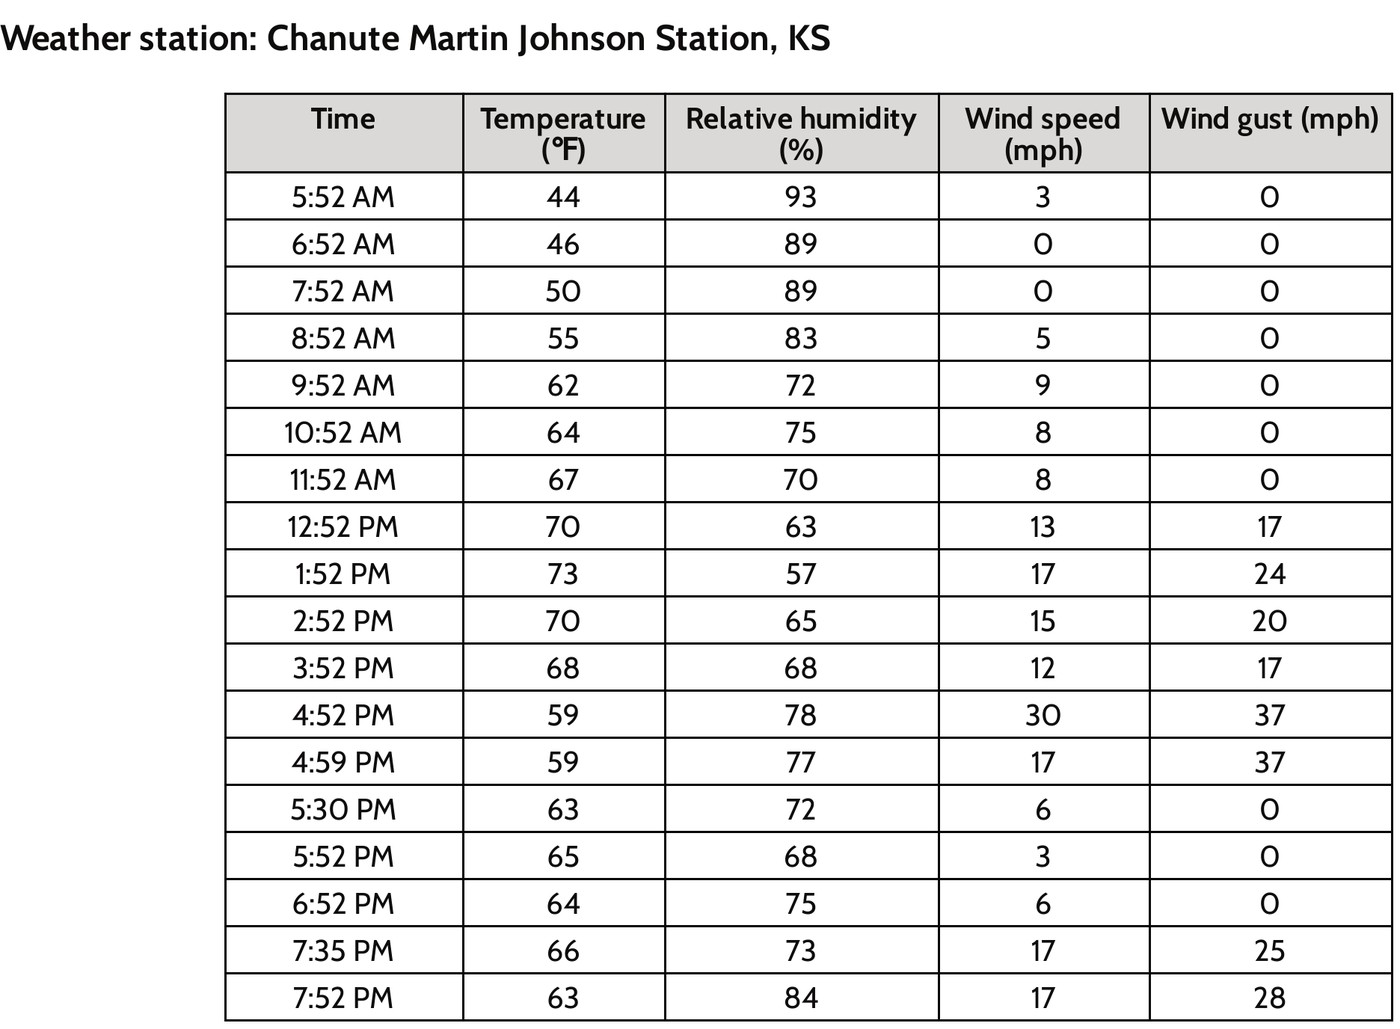
A time series orders observations using the same location and measurement convention. In the supplied record, temperature rises before dropping, pressure falls before recovering and wind shifts toward the northwest as showers end. Together those indicators support a front-passage interpretation more strongly than a temperature drop alone. A forecast should state where, when and which measurable conditions are expected, plus what could change it. Later observations can test both the predicted event and its timing; matching only a broad statement such as weather changes is weak verification.
Read the visual model
Read the temperature curve alongside the written pressure and wind sequence. The measurements have different units and should be related mechanistically rather than added.
What strengthens the front-passage inference beyond the fall from 23 to 16 °C?
Visual reasoning — after your attempt
Pressure reversal, wind-direction change, precipitation sequence and a corresponding mapped front support the inference. Temperature alone can change for other reasons.
Use a time series of pressure, temperature, humidity, wind and precipitation to infer a changing system. A single temperature drop is less diagnostic than a related set of observations and a mapped front. Forecast reasoning should state expected sequence and what could alter it.
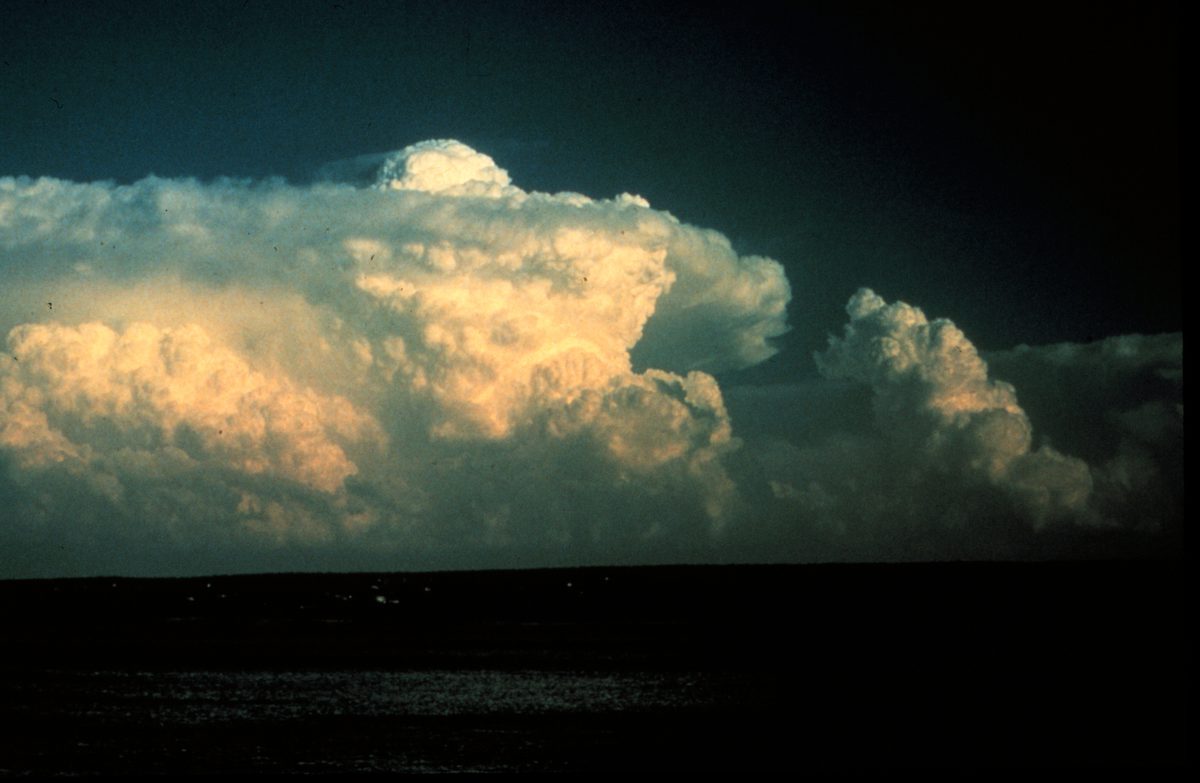
A passage with rain, wind shift and falling temperature may support a cold-front interpretation. Compare the map and timing to test the explanation instead of assigning the type from rain alone.
Pause and explain
What strengthens a front-passage inference beyond one temperature reading?
Check your reasoning after answering
Consistent wind, pressure, moisture and precipitation changes, linked to mapped movement.
Apply the whole unit · Interpret a front passage
Illustrative station series: before passage 22 °C with southerly wind and falling pressure; afterward 12 °C with northwesterly wind and rising pressure; rain occurs near the transition.
Your task
Propose a frontal interpretation, explain uplift and the sequence, and state an alternative or missing observation needed to test it.
What your response should show
- Use the supplied evidence accurately and label units or locations.
- Explain a physical mechanism or evidence-to-claim relationship.
- Show calculations or a clearly labeled model when the task calls for one.
- Identify a meaningful assumption, uncertainty, or competing explanation.
Response guidance — after your attempt
The combined pattern supports a cold-front passage, subject to map confirmation and timing. Cooler advancing air can lift warmer moist air. Rain alone is insufficient; compare regional observations and front positions before treating the inference as certain.
Scientific references and adapted source material
Parent / teacher teaching notes
Teach map symbols alongside a side-view sketch. Ask how wind, pressure and air-mass contrast relate; accept qualified alternatives with consistent evidence. Ask the learner to explain each visual label and causal step before calculating. Preserve a first model, attempt the changed independent case, then use feedback to revise. Diagrams state whether values are illustrative or observed. Selected OpenSciEd excerpts are middle-school source material used for supported foundations; the independent high-school explanations and supplements are not the complete OpenSciEd teacher editions or an endorsement.
The key idea
Air masses take on the temperature and moisture of where they form; cold fronts bring fast, intense weather while warm fronts bring slow, gentle weather; high pressure means sinking air and clear skies, and low pressure means rising air and storms.
Worked examples
Example 1
- A quick temperature drop and sudden gusty winds point to a fast-moving boundary, not a slow one.
- A short, intense burst of stormy weather (rather than hours of steady light rain) matches the steep slope of a cold front, which forces warm air upward quickly.
- Clearing skies and colder air right afterward fit too — a fresh, cold air mass has now taken over behind the front.
Example 2 · Worked application
- The advancing cold mass lifts warmer air.
- Lifting can cool moist air to condensation, producing clouds and precipitation.
A front does not guarantee identical weather everywhere.
Example 3
- It forms over land, far from any large body of water, so its moisture label is continental (c) — expect it to be dry.
- It forms at a high, cold latitude, so its temperature label is polar (P) — expect it to be cold.
- Combined, it's a continental polar (cP) air mass.
Example 4
- A cooler air mass replacing warmer air fits the temperature drop.
- The wind shift and precipitation add supporting evidence.
Example 5 · Find and fix the mistake
- Test the claim against the stated conditions: A front does not guarantee identical weather everywhere.
- Pressure systems influence patterns, but humidity, fronts, lifting and regional conditions also determine weather.
A front does not guarantee identical weather everywhere.
Example 6 · Reason from the visual evidence
- Trace the cool-air advance separately from the warmer-air uplift. The sloping boundary is a schematic cold front, not an identical geometry for every front.
- Available moisture, stability, local flow and timing vary. Lifting supplies a process, while those conditions influence whether and how precipitation develops.
Original cold-front cross-section with qualitative density contrast and uplift. Layer slopes and arrow lengths are not measured values. The text compares warm-front geometry separately and identifies the conditions omitted from this simple cross-section.
Avoid these mistakes
- A cold front does not guarantee the same kind of storm in every setting.
Check your understanding
A station records a wind shift, falling temperature and a band of rain passing through. What front model fits?
Discuss the answer
A passing cold front is plausible; a map and additional observations would test it.
Why does closely spaced pressure-contour information matter for wind prediction?
Discuss the answer
For the same interval and ground scale, closer isobars indicate a stronger pressure gradient, one force influencing wind. Rotation/friction also modify motion, and different isobar intervals must not be compared by spacing alone.
Return to the phenomenon
Return to the initial case. Why does a passing front change more than temperature? Revise your drawing or explanation using two named ideas and one stated limitation.
Compare explanations after your attempt
A front separates contrasting air masses and can lift moist air. Several linked station indicators support a passage inference, while source labels, pressure gradients and rotation/friction help explain the broader system.
What should we investigate next?
Which comparison would test a remaining uncertainty? State what you would change, keep comparable and measure.
Investigate, explain and revise
Complete the tasks after studying the visual parts. Keep the first model and explain a revision before consulting the guidance.
Activity 1 · Explain the opening case
Use this unit’s opening record, Parts 1–4 and your notebook model. No external equipment or text is required for this supplied-data route.
Your task
Return to the initial case. Why does a passing front change more than temperature? Revise your drawing or explanation using two named ideas and one stated limitation.
Success criteria
- Use two stated observations or conditions.
- Connect the mechanism to a labeled diagram or calculation.
- Identify what your original model missed.
- State a useful further test and a limitation.
Hint
Name the quantities and interactions before assigning a cause.
Response guidance — discuss after your attempt
A front separates contrasting air masses and can lift moist air. Several linked station indicators support a passage inference, while source labels, pressure gradients and rotation/friction help explain the broader system.
Activity 2 · Transfer to a changed case
Use the figures, captions and vocabulary in this unit; cover the worked answer.
Your task
Two maps have the same ground scale. Map A shows a 4 hPa change over 100 km; map B a 2 hPa change over 25 km. Compare pressure-gradient magnitudes and explain why neither gives a full wind direction alone.
Success criteria
- Use the stated measurements or conditions, with correct units.
- Connect the result to the physical mechanism or evidence relationship.
- Identify the assumption, model limit or further evidence requested.
Hint
Separate measured values, calculated results and model assumptions.
Response guidance — discuss after your attempt
A is 0.04 hPa/km; B is 0.08 hPa/km, twice as large. Actual wind also responds to rotation and friction, so pressure-gradient magnitude alone is not a complete directional forecast.
Words to know
- air mass
- A huge body of air that takes on a fairly uniform temperature and humidity from the surface it sits over for days at a time.
- front
- The boundary where two different air masses meet — usually the setting for a region's most active weather.
- air pressure
- The weight of the air pressing down on a given area, measured with a barometer.
- barometer
- An instrument that measures air pressure, useful for tracking whether weather is likely to clear or worsen.
Why wind spirals instead of blowing straight into a low
If Earth didn't rotate, wind would simply blow in a straight line from high pressure to low pressure. But Earth's rotation deflects moving air (and anything else moving over long distances, like ocean currents) to the right in the Northern Hemisphere and to the left in the Southern Hemisphere — an effect named after French scientist Gaspard-Gustave de Coriolis. That deflection is why wind spirals counterclockwise into a Northern Hemisphere low-pressure system rather than flowing straight toward its center, and why hurricanes and other storm systems always rotate the same direction in a given hemisphere.
The scientists who first mapped fronts as we know them
The very idea of a weather 'front' — language borrowed from World War I battle lines — was developed in the 1920s by Norwegian meteorologist Vilhelm Bjerknes and his research group, known as the Bergen School. Before their work, forecasters had no organized model for how storms formed; the Bergen School's insight that storms develop where a cold air mass and warm air mass collide, and that they follow a predictable life cycle, became the foundation of the modern forecasting techniques still taught in this lesson today.
Lake-effect snow: New York's own air-mass specialty
Upstate New York, especially areas like Buffalo, Syracuse, and the Tug Hill Plateau, experiences one of the most dramatic local examples of air masses interacting with geography: lake-effect snow. A cold, dry continental polar air mass sweeping across the relatively warm, unfrozen waters of the Great Lakes picks up huge amounts of moisture and heat from the lake surface, then dumps it as intense, highly localized snow bands as soon as the air mass reaches colder land again — sometimes burying one town in feet of snow while a town twenty miles away stays nearly dry.
Nor'easters: when ocean moisture meets cold coastal air
The Hudson Valley and greater New York region's most notorious storms are nor'easters — powerful coastal storms named for the northeasterly winds that blow into the coast on their leading edge. They form when a strong temperature contrast develops along the Atlantic coastline, often as cold continental air clashes with the relatively warm, moisture-rich air over the Gulf Stream, intensifying rapidly into a strong low-pressure system that can bring heavy snow, damaging wind, and coastal flooding — a direct real-world example of the fronts and pressure systems described in this lesson.
In the real world
Forecasters track approaching fronts and pressure changes days in advance — it's exactly how they can warn Westchester County of a cold snap or a rainy weekend before the first cloud appears.
Exit check
Why might a forecast use wind, pressure, moisture, and temperature together?
Check your explanation after answering
Each constrains a different part of the air-mass and circulation pattern. Together they support a stronger explanation than a single measurement, but the forecast remains uncertain.
Explain your reasoning without notes. If a key idea is missing, revisit the lesson and try again.
Problem 1
- Cold and dry
- Cold and moist
- Warm and dry
- Warm and moist
Answer and explanation
Cold and dry
'Continental' means it formed over land (dry), and 'polar' means it formed at a cold latitude.
Problem 2
- Front
- Barometer
- Isobar
- Station model
Answer and explanation
Front
The boundary between two air masses is a front — it's where the most active weather usually happens.
Problem 3
- Cold fronts move fast and bring brief, intense weather; warm fronts move slowly and bring longer, lighter weather.
- Cold fronts move slowly and bring long light rain; warm fronts move fast and bring brief storms.
- Both move at the same speed and bring identical weather.
- Warm fronts only occur in summer.
Answer and explanation
Cold fronts move fast and bring brief, intense weather; warm fronts move slowly and bring longer, lighter weather.
Cold fronts are steep and fast-moving, causing quick, intense weather; warm fronts are gradual and slow-moving, causing longer, gentler weather.
Problem 4
- High pressure
- Low pressure
- A stationary front
- An occluded front
Answer and explanation
High pressure
Sinking air piles up near the ground, creating high pressure and generally fair weather.
Problem 5
- A low-pressure system, with cloudier, stormier weather ahead
- A high-pressure system, with clear, calm weather ahead
- No change in the weather at all
- A broken barometer
Answer and explanation
A low-pressure system, with cloudier, stormier weather ahead
A reading well below the roughly 1013-millibar average indicates lower-than-average pressure, which is associated with rising air and increasing clouds or storms.
Problem 6
Answer and explanation
Air naturally flows from where it is denser and pressing down harder (high pressure) toward where it is less dense and pressing down less (low pressure), trying to balance out the difference — that flow of air from high to low is what we feel as wind.
Problem 7
Answer and explanation
A passing cold front is plausible; a map and additional observations would test it.
A cooler air mass replacing warmer air fits the temperature drop.
The wind shift and precipitation add supporting evidence.
Response criteria
- Use the stated conditions.
- Show the evidence or calculation.
- Explain the conclusion and any stated limitation.
Problem 8
Hints
A front does not guarantee identical weather everywhere.
Answer and explanation
Expansion and cooling can bring air to saturation, allowing condensation.
Problem 9
Hints
State what the supplied observations or conditions establish, and separate that from any assumption.
Answer and explanation
Temperature, humidity, origin region and movement provide important context.
Problem 10
Answer and explanation
Available moisture, stability, local flow and timing vary. Lifting supplies a process, while those conditions influence whether and how precipitation develops.
Trace the cool-air advance separately from the warmer-air uplift. The sloping boundary is a schematic cold front, not an identical geometry for every front.
Available moisture, stability, local flow and timing vary. Lifting supplies a process, while those conditions influence whether and how precipitation develops.
Response criteria
- Read the labeled quantities, reference frame or objects correctly.
- Explain the relation between the visual evidence and the mechanism.
- Keep the drawing’s stated assumptions and limits in the conclusion.
Problem 11
Answer and explanation
A is 0.04 hPa/km; B is 0.08 hPa/km, twice as large. Actual wind also responds to rotation and friction, so pressure-gradient magnitude alone is not a complete directional forecast.
Calculate 4/100 and 2/25 in matched units.
Compare 0.08 with 0.04: factor two.
Include rotation/friction and distinguish pressure-gradient force from wind.
Response criteria
- Use the stated measurements or conditions, with correct units.
- Connect the result to the physical mechanism or evidence relationship.
- Identify the assumption, model limit or further evidence requested.