Earth, Moon & Solar System — Print · Earth & Space Science, Grade 9
Model sky patterns, seasons, tides, and predictable orbital motion.
Printable chapter lessons and review.
Earth, Moon & Sun: Moon Phases
Learning goals
- I can explain that moon phases are caused by our changing view of the Moon's sunlit half, not by Earth's shadow.
- I can put the eight phases of the Moon in order, from new moon to full moon and back.
- I can explain why lunar and solar eclipses are rare compared to the regular monthly phases.
Readings for this unit
Before this unit
Use a Sun–Earth–Moon diagram and distinguish illumination from shadow.
Plan three teaching sessions: core explanation and Parts 1–2; Parts 3–4 with diagrams and reasoning checks; then the whole-unit application, worked examples, independent practice, and exit check. Read one part at a time, explain it without notes, and revisit any gap. Allow about 40–50 minutes per session; adjust after checking understanding. Trace and explain the labeled figures in each part. In the third session, complete the illustrated case and changed independent application; retain a corrected explanation rather than only an answer.
Start with something to explain
Why does the Moon change appearance without changing its size?
Illustrative evidence case. Ordinary Sun illumination lights about half the Moon, while Earth sees different fractions as relative geometry changes. Eclipses happen less often than new/full phases.
Notice and wonder
Record two observations using the stated quantities or relationships. Keep observations separate from possible causes. Write one question that a new measurement could help answer.
Why does the Moon change appearance without changing its size?
Your first model
Draw Sun-facing illumination, Earth’s viewpoint and a separate tilted-orbit side view.
Build the language from the idea
- phase
- One of the recurring shapes the Moon appears to have from Earth, caused by how much of its sunlit half we can see.
- waxing
- Describes a Moon that is growing more lit each night, moving toward full moon.
- waning
- Describes a Moon that is shrinking, getting less lit each night, moving toward new moon.
- new moon
- The phase when the Moon's unlit side faces Earth, making it nearly invisible in the sky; the start (and end) of the monthly cycle.
- synodic month
- Average new-to-new lunar phase cycle of about 29.5 days; distinct from the approximately 27.3-day orbit relative to distant stars.
Let's clear up the single most common misunderstanding about the Moon right away: its phases are not caused by Earth's shadow falling across it. The Sun is always lighting up exactly half of the Moon — the half facing the Sun — just as it always lights exactly half of Earth (the half where it's daytime). The Moon isn't changing how much of it is lit; what changes is how much of that lit half we can see from down here, because the Moon is constantly circling us. A phase is simply the name for how much of the sunlit half is turned toward us on a given night.
Picture the geometry. When the Moon sits roughly between Earth and the Sun, its lit half faces away from us and we see almost nothing — a new moon. When the Moon is on the far side of Earth from the Sun, its entire lit half faces us and we see a full moon. In between, we catch that lit half at an angle, so we see only a slice of it. That's why the Moon seems to change shape night after night — we're really just viewing the same half-lit ball from a slightly different angle as it travels around us.
Over about 29.5 days — one new-to-new illumination cycle, called a synodic month; the Moon’s orbit relative to distant stars takes about 27.3 days — the Moon runs through eight phases in the same order every single time: new moon → waxing crescent → first quarter (exactly half-lit) → waxing gibbous → full moon → waning gibbous → third quarter (half-lit again) → waning crescent → and back to new. The vocabulary just describes what your eyes see: waxing means the lit portion is growing night to night, waning means it's shrinking, gibbous means more than half is lit, and crescent means less than half. So a 'waxing crescent' is a thin sliver that's getting fatter, and a 'waning gibbous' is a mostly-full Moon that's slimming down.
Eclipses are a completely different, and much rarer, event — and this is where Earth's shadow finally does matter. A lunar eclipse can only happen at full moon, when Earth passes directly between the Sun and Moon and casts its shadow onto the Moon, sometimes tinting it a dim, coppery red. A solar eclipse can only happen at new moon, when the Moon slips directly between us and the Sun and briefly blocks it out. So eclipses are special alignments, not the ordinary monthly phases.
If that's true, why don't we get a pair of eclipses every single month, at every full and new moon? The answer is a small tilt. The Moon's orbit is tipped about 5° relative to Earth's own path around the Sun, so most months the Moon passes a little above or a little below the perfect Sun-Earth-Moon line, and its shadow (or Earth's) misses. Only a few times a year do the three bodies line up exactly enough for an eclipse — which is precisely why a total eclipse feels like such a rare treat, while the phases roll around dependably every single month.
The Sun illuminates about half the Moon at a time, and phases show how much of that illuminated half is visible from Earth. The ordinary monthly phase sequence does not result from Earth's shadow; an eclipse is a special alignment.
The Moon's orbit is tilted relative to Earth's orbital plane, so eclipses do not occur at every new or full moon. A flat classroom diagram hides that tilt. State whether the diagram is a view from space or from Earth's surface.
Predict a phase using relative positions, then describe the observer's view. The Moon's rotation and revolution periods are approximately matched, so broadly the same side faces Earth. That near side still experiences day and night and is not always illuminated.
Build your understanding
Plan three teaching sessions: core explanation and Parts 1–2; Parts 3–4 with diagrams and reasoning checks; then the whole-unit application, worked examples, independent practice, and exit check. Read one part at a time, explain it without notes, and revisit any gap. Allow about 40–50 minutes per session; adjust after checking understanding.
Part 1 · Separate illumination from the view from Earth
Sunlight illuminates approximately half of the Moon at any ordinary phase. The fraction of that lit hemisphere visible from Earth depends on relative geometry. Near new Moon, the Moon is toward the Sun’s direction and its lit side faces mostly away from us. Near full Moon it is roughly opposite the Sun and we see nearly the whole lit hemisphere. The Moon’s own shadowed side is different from Earth casting a shadow onto it. Earth’s shadow creates a lunar eclipse only under special alignment; it is not responsible for the regular phase sequence.
Read the visual model
All four Moon positions retain a Sun-facing illuminated half. Compare the direction from each Moon toward the Earth observer; these little disks are space-view hemispheres, not the identical apparent views from Earth.
Why is a crescent not evidence that Earth’s shadow covers most of the Moon?
Visual reasoning — after your attempt
Ordinary phase geometry lets Earth see only part of the Moon’s Sun-lit hemisphere. Earth’s shadow is a separate eclipse phenomenon under special alignment.
Sunlight illuminates approximately half the Moon at a time. A phase describes how much of that illuminated hemisphere is visible from Earth. Earth, Moon and Sun geometry changes as the Moon orbits. Earth’s shadow produces a lunar eclipse under suitable alignment; it does not create the ordinary monthly phase sequence.
Draw the illuminated half facing the Sun first, then mark the Earth-based line of sight. This prevents shading the Moon according to what an observer sees rather than its actual illumination.
Pause and explain
Why is a crescent not evidence that most of the Moon is in Earth’s shadow?
Check your reasoning after answering
Ordinary phases result from viewing geometry; roughly half remains sunlit apart from eclipse conditions.
Part 2 · Track waxing and waning through a cycle
Waxing means the visible illuminated fraction is increasing; waning means it is decreasing. First and third quarter refer to roughly one quarter and three quarters through the phase cycle, even though the visible disk is about half lit at either stage. The average new-to-new cycle is about 29.5 days; orbital speed and actual appearance vary. Left/right orientation of the bright part also depends on observer viewpoint, so use relative fraction and consistent geometry rather than assuming one picture orientation is universal. The Moon is not growing or physically shrinking.
Read the visual model
Locate the rising and falling portions of the ideal fraction curve. Both quarter points reach one half, but the direction of change differs.
How can first and third quarter have the same illuminated fraction but different phase names?
Visual reasoning — after your attempt
Both appear about half lit; first quarter is on the waxing half of the cycle and third quarter on the waning half. The names describe cycle position rather than one-quarter illumination.
Waxing means the visible illuminated fraction is increasing; waning means it is decreasing. Quarter names refer to the stage of the cycle while the visible disk is approximately half lit. Use a consistent orbit diagram and observer location to relate phase, position and changing view.
A first-quarter Moon is not one quarter of a visible disk lit. The phase occurs about one quarter through the cycle; one half of the disk is illuminated as seen from Earth.
Pause and explain
Why do first and third quarter often look half illuminated?
Check your reasoning after answering
Quarter describes orbital-cycle stage, while the visible illuminated area is about half the disk.
Part 3 · Relate phase to sky position and timing
Near full phase, the Moon is roughly opposite the Sun in the sky. As Earth rotates, a location turning away from the setting Sun can see the full Moon toward the opposite horizon. That supports the approximate relation full Moon rises near sunset and sets near sunrise. Near new phase it is closer to the Sun’s sky direction, making ordinary observation harder against daylight and glare. Inclination, latitude and date alter exact timing. These are geometric patterns, not a precise local rise/set table, and safe observations never require looking directly at the Sun.
Read the visual model
Read the arrangement as an ideal full-phase sky-direction relation. Distances are exaggerated and the Moon’s illuminated side faces back toward the Sun.
Why is a full Moon commonly visible at night even though sunlight supplies its illumination?
Visual reasoning — after your attempt
It lies approximately opposite the Sun from Earth, so its illuminated face can be above the night-side observer’s horizon while the Sun is below it. Exact times depend on the stated conditions.
Relative position to the Sun helps determine when the Moon is visible. Near full Moon it is roughly opposite the Sun in the sky; near new Moon it is near the Sun’s direction. Approximate rise/set relationships are models affected by location, orbit inclination and date. Avoid exact timing without observation or a suitable ephemeris.
A near-full Moon is often visible during the night because Earth faces it on the night side. Explain the geometry instead of memorizing a clock time without conditions.
Pause and explain
Why is a full Moon generally visible at night?
Check your reasoning after answering
It lies roughly opposite the Sun as viewed from Earth, placing it above the night-side sky.
Part 4 · Explain why eclipses are less frequent than phases
The Moon’s orbital plane is tilted by about 5° relative to Earth’s orbital plane around the Sun. The two planes cross along a line with two nodes, or crossing directions. Near most new/full phases, the Moon is above or below the shadow alignment, so no solar or lunar eclipse occurs. An eclipse requires the appropriate phase plus alignment near a node. A top-view phase diagram can hide the vertical separation and mistakenly suggest monthly eclipses. Combine top and side views to explain both the regular phase cycle and the less frequent shadow events.
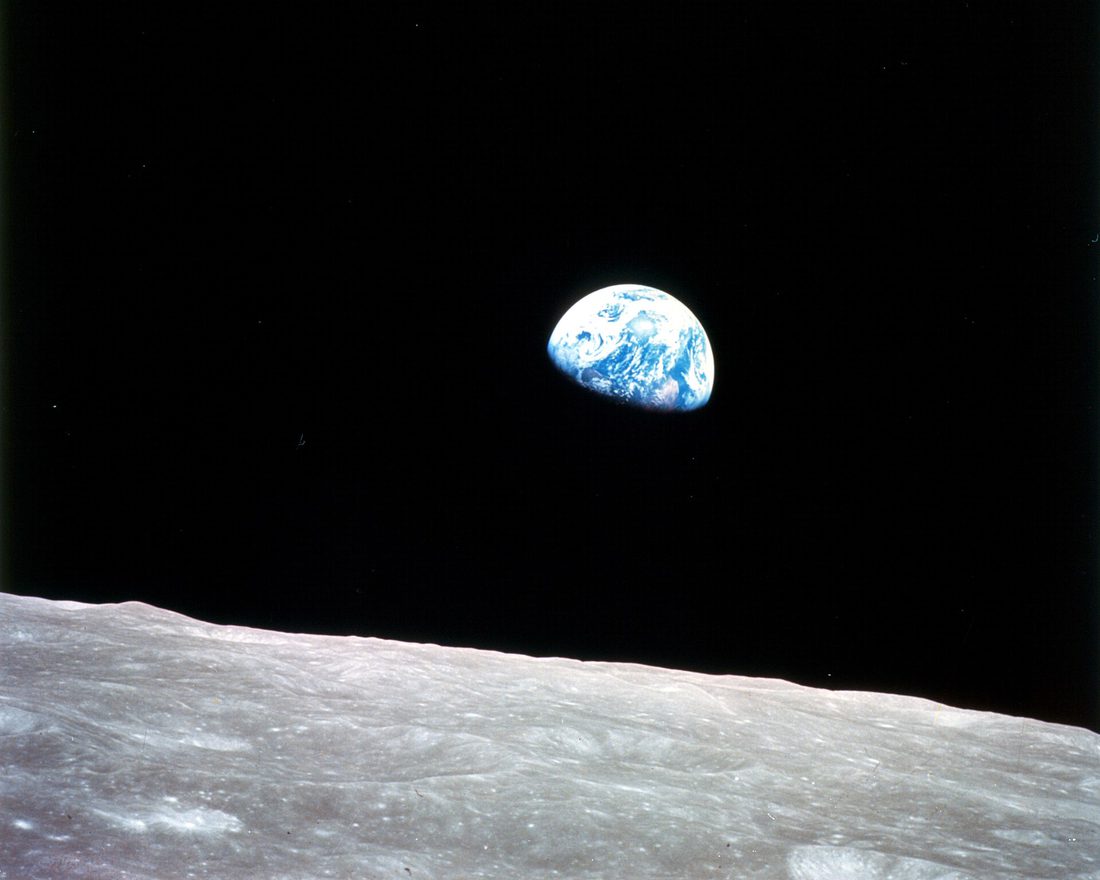
Read the visual model
Compare the tilted blue orbital section with the gold Sun–Earth reference line. The tilt is exaggerated for visibility.
Why is new Moon necessary but insufficient for a solar eclipse?
Visual reasoning — after your attempt
It puts the Moon toward the Sun from Earth, but the Moon must also lie near the shadow alignment/node rather than above or below it.
The Moon’s orbital plane is tilted relative to Earth’s orbital plane. Most new/full alignments pass above or below the needed shadow line. Eclipses require alignment near orbital crossing regions. An orbital-plane diagram is needed to explain frequency; a flat top view alone hides the tilt.
A new Moon is necessary for a solar eclipse but not sufficient. Add a side view showing the orbital tilt and ask whether the Moon crosses the line of sight at that time.
Pause and explain
Why is there not a solar eclipse at every new Moon?
Check your reasoning after answering
The tilted lunar orbit usually misses the precise Sun–Moon–Earth alignment needed.
Apply the whole unit · A phase-model critique
Illustrative student claim: the Moon is half lit at first quarter because Earth blocks half the sunlight; every following new Moon must eclipse the Sun.
Your task
Draw two labeled views correcting both claims, explain phase versus eclipse, and state which sizes and distances your model does not preserve.
What your response should show
- Use the supplied evidence accurately and label units or locations.
- Explain a physical mechanism or evidence-to-claim relationship.
- Show calculations or a clearly labeled model when the task calls for one.
- Identify a meaningful assumption, uncertainty, or competing explanation.
Response guidance — after your attempt
First quarter reflects the visible portion of the sunlit hemisphere, not ordinary shadowing by Earth. Orbital tilt prevents an eclipse at most new Moons. Label the Sunward illuminated half, observer and tilted orbital relation; the model is schematic.
Scientific references and adapted source material
Parent / teacher teaching notes
Use a safe lamp-and-ball demonstration without looking toward the Sun. Ask the learner to keep illumination and observed disk separate, and add a side view for eclipse reasoning. Ask the learner to explain each visual label and causal step before calculating. Preserve a first model, attempt the changed independent case, then use feedback to revise. Diagrams state whether values are illustrative or observed. Selected OpenSciEd excerpts are middle-school source material used for supported foundations; the independent high-school explanations and supplements are not the complete OpenSciEd teacher editions or an endorsement.
Animation of the Moon orbiting Earth, showing the eight phases (new, waxing crescent, first quarter, waxing gibbous, full, waning gibbous, third quarter, waning crescent) as the sunlit half comes into and out of view.
The key idea
Moon phases come from watching different portions of the Moon's always-half-lit surface as it orbits Earth — eclipses are the rarer case when Earth's shadow or the Moon itself actually blocks the light.
Moon Phase Timing
days since new moon ≈ (fraction of cycle) × 29.5
one full cycle of phases (a synodic month) takes about 29.5 days; e.g., first quarter is 1/4 of the way through (~7.4 days) and full moon is halfway (~14.75 days).
Worked examples
Example 1
- The full cycle from new moon back to new moon takes about 29.5 days.
- The four main phases (new, first quarter, full, third quarter) are evenly spaced around that cycle, so divide the cycle into 4 equal parts.
- 29.5 ÷ 4 ≈ 7.4 days.
Example 2 · Worked application
- The Sun usually illuminates approximately half the Moon's sphere.
- Earth's viewing angle exposes part of that lit half.
- First quarter describes the orbital phase, not illumination of only a quarter of the entire sphere.
Separate the visible disk from the whole sphere.
Example 3
- Full moon is the phase directly opposite new moon in the cycle — halfway around.
- Divide the full cycle in half: 29.5 ÷ 2 = 14.75.
- Round to a whole number of days.
Example 4
- A full moon places the bodies roughly along a line.
- The tilted lunar orbit usually places the Moon above or below Earth's shadow.
Example 5 · Find and fix the mistake
- Test the claim against the stated conditions: Separate the visible disk from the whole sphere.
- Phases result from viewing geometry. Earth's shadow causes a lunar eclipse only under special alignment.
Separate the visible disk from the whole sphere.
Example 6 · Reason from the visual evidence
- Read the arrangement as an ideal full-phase sky-direction relation. Distances are exaggerated and the Moon’s illuminated side faces back toward the Sun.
- It lies approximately opposite the Sun from Earth, so its illuminated face can be above the night-side observer’s horizon while the Sun is below it. Exact times depend on the stated conditions.
Original ideal alignment for interpreting full-phase viewing. It omits orbital tilt and real horizon/atmospheric effects and does not depict an eclipse. Labels state approximate timing, not an operational observation schedule or encouragement to view the Sun directly.
Avoid these mistakes
- The far side of the Moon is not a permanently dark side.
Check your understanding
At full moon, Earth lies roughly between Sun and Moon. Why is the Moon usually not eclipsed?
Discuss the answer
Orbital tilt usually prevents an exact shadow alignment.
What causes ordinary moon phases instead of eclipses?
Discuss the answer
Sunlight illuminates approximately half the Moon while Earth sees different fractions as geometry changes. Earth’s shadow produces a lunar eclipse only with appropriate alignment; it does not cause the regular phases.
Return to the phenomenon
Return to the initial case. Why does the Moon change appearance without changing its size? Revise your drawing or explanation using two named ideas and one stated limitation.
Compare explanations after your attempt
Monthly phases depend on Earth’s view of the lit hemisphere, not Earth’s shadow. Waxing/waning follow changing visible fraction; eclipses require additional node alignment in the tilted orbit.
What should we investigate next?
Which comparison would test a remaining uncertainty? State what you would change, keep comparable and measure.
Investigate, explain and revise
Complete the tasks after studying the visual parts. Keep the first model and explain a revision before consulting the guidance.
Activity 1 · Explain the opening case
Use this unit’s opening record, Parts 1–4 and your notebook model. No external equipment or text is required for this supplied-data route.
Your task
Return to the initial case. Why does the Moon change appearance without changing its size? Revise your drawing or explanation using two named ideas and one stated limitation.
Success criteria
- Use two stated observations or conditions.
- Connect the mechanism to a labeled diagram or calculation.
- Identify what your original model missed.
- State a useful further test and a limitation.
Hint
Name the quantities and interactions before assigning a cause.
Response guidance — discuss after your attempt
Monthly phases depend on Earth’s view of the lit hemisphere, not Earth’s shadow. Waxing/waning follow changing visible fraction; eclipses require additional node alignment in the tilted orbit.
Activity 2 · Transfer to a changed case
Use the figures, captions and vocabulary in this unit; cover the worked answer.
Your task
A student argues that first quarter must show one quarter of the lunar disk lit and every new Moon causes a solar eclipse. Correct both statements with geometry.
Success criteria
- Use the stated measurements or conditions, with correct units.
- Connect the result to the physical mechanism or evidence relationship.
- Identify the assumption, model limit or further evidence requested.
Hint
Separate measured values, calculated results and model assumptions.
Response guidance — discuss after your attempt
First quarter describes about one-quarter of the phase cycle and the visible disk is roughly half lit. New Moon alone does not guarantee a solar eclipse because the tilted lunar orbit usually misses the shadow line; alignment near a node is also needed.
Words to know
- phase
- One of the recurring shapes the Moon appears to have from Earth, caused by how much of its sunlit half we can see.
- waxing
- Describes a Moon that is growing more lit each night, moving toward full moon.
- waning
- Describes a Moon that is shrinking, getting less lit each night, moving toward new moon.
- new moon
- The phase when the Moon's unlit side faces Earth, making it nearly invisible in the sky; the start (and end) of the monthly cycle.
- synodic month
- Average new-to-new lunar phase cycle of about 29.5 days; distinct from the approximately 27.3-day orbit relative to distant stars.
Why we only ever see one face of the Moon
The Moon rotates on its axis in exactly the same amount of time it takes to orbit Earth once — a state called tidal locking — which is why the same lunar face always points toward Earth. This isn't a coincidence: over billions of years, Earth's gravity pulled on a slight bulge in the Moon's shape, gradually slowing its spin until the two rhythms matched perfectly. Because of this, the phrase 'dark side of the Moon' is actually a myth — the far side gets just as much sunlight as the near side over the course of a lunar day; it's simply a side we never see from Earth, not a side that's permanently dark.
Supermoons: when a full moon gets a boost from its oval orbit
The Moon's orbit isn't a perfect circle — it's a slight ellipse, meaning its distance from Earth varies from about 226,000 miles at its closest (perigee) to about 251,000 miles at its farthest (apogee). When a full moon happens to line up with perigee, it appears roughly 14% larger and about 30% brighter than a full moon at apogee — an event popularly nicknamed a supermoon. It's a real, measurable effect of orbital geometry, though the size difference is often subtler to the naked eye than photos suggest.
Why the moon-phase cycle is 29.5 days, not 27.3
The Moon's actual orbit around Earth, measured against the background stars, takes only about 27.3 days — called a sidereal month. But the cycle of phases we actually observe (the synodic month) takes about 29.5 days, over two days longer. The gap exists because Earth itself is also orbiting the Sun the whole time, so after the Moon completes one 27.3-day loop, it hasn't quite caught back up to the same alignment with the Sun yet — it needs a couple of extra days to 'catch up' to the new Earth-Sun line, which is why phases and the Moon's actual orbit run on two slightly different clocks.
An ancient computer that predicted moon phases with gears
In 1901, divers exploring an ancient Greek shipwreck near the island of Antikythera recovered a corroded lump of bronze that turned out to be one of the most astonishing discoveries in the history of science: the Antikythera mechanism, a hand-cranked mechanical device from roughly 100 BCE containing dozens of precisely cut bronze gears that modeled the Moon's phases and predicted eclipses. Nothing of comparable mechanical complexity would be built again for over a thousand years — proof that ancient astronomers understood the predictable, cyclical mathematics of the Moon's motion described in this lesson far earlier than most people realize.
In the real world
Tide charts, fishing and hunting almanacs, and lunar calendars — like the ones used to set the dates for Ramadan or the Lunar New Year — are all built around tracking the Moon's predictable phase cycle.
Exit check
Why do Moon phases occur without Earth’s shadow covering the Moon each month?
Check your explanation after answering
The Sun illuminates about half the Moon. As the Moon orbits, we see different fractions of that lit half. Earth’s shadow causes a lunar eclipse only under a suitable alignment.
Explain your reasoning without notes. If a key idea is missing, revisit the lesson and try again.
Seasons & Earth's Tilt
Learning goals
- I can explain that Earth's tilt, not its distance from the Sun, causes the seasons.
- I can determine the season for a hemisphere given a date and Earth's position in its orbit.
- I can explain why more direct sunlight heats Earth's surface more than indirect sunlight.
Readings for this unit
Before this unit
Relate light angle and day length to Earth's tilt.
Plan three teaching sessions: core explanation and Parts 1–2; Parts 3–4 with diagrams and reasoning checks; then the whole-unit application, worked examples, independent practice, and exit check. Read one part at a time, explain it without notes, and revisit any gap. Allow about 40–50 minutes per session; adjust after checking understanding. Trace and explain the labeled figures in each part. In the third session, complete the illustrated case and changed independent application; retain a corrected explanation rather than only an answer.
Start with something to explain
Why do Australia and New York have opposite seasons at the same time?
Illustrative evidence case. Earth’s axis remains approximately fixed over one orbit; opposite hemispheres alternate their tilt toward the Sun.
Notice and wonder
Record two observations using the stated quantities or relationships. Keep observations separate from possible causes. Write one question that a new measurement could help answer.
Why do Australia and New York have opposite seasons at the same time?
Your first model
Draw the same axis orientation at two orbital positions and compare sunlight angle and duration.
Build the language from the idea
- axis
- The imaginary line Earth spins around, running through the North and South Poles.
- tilt
- The 23.5° lean of Earth's axis away from vertical, relative to its orbital plane.
- solstice
- One of two days a year (around June 21 and December 21) when a hemisphere is angled most directly toward or away from the Sun, giving the year's longest or shortest day.
- equinox
- One of two days a year (around March 20 and September 22) when Earth's tilt is sideways to the Sun, so day and night are roughly equal length nearly everywhere.
It's one of the most natural guesses in all of science, and it's wrong: summer is not caused by Earth swinging closer to the Sun, and winter is not caused by it drifting away. We can prove it with a single stubborn fact — Earth is actually at its closest point to the Sun (called perihelion) in early January, smack in the middle of Northern Hemisphere winter. Earth's orbit is very nearly a circle, so its distance from the Sun barely changes across the year, and that tiny change isn't what drives the seasons at all.
The real cause is the tilt of the Earth. Our planet's axis — the imaginary line it spins around, running from pole to pole — isn't straight up and down relative to its orbit; it leans over by about 23.5°. And here's the crucial part: that lean always points the same direction in space (toward the North Star, Polaris) all year long, no matter where Earth is in its orbit. So as Earth circles the Sun, each hemisphere spends part of the year tipped toward the Sun and part of the year tipped away.
Why should the direction of a tilt change the temperature? Because of how sunlight strikes the ground. When the Sun is high overhead, its rays hit at a steep, direct angle and their energy is concentrated onto a small patch of ground, heating it strongly. When the Sun is low, the same rays strike at a shallow, glancing angle and smear their energy across a much larger area, so any one patch heats up far less — think of shining a flashlight straight down on a table versus tilting it sideways so the light spreads into a dim oval. A hemisphere tipped toward the Sun also gets longer days, piling even more heating onto the same ground.
That's what the calendar's turning points mark. Around June 21, the summer solstice, the Northern Hemisphere leans most directly toward the Sun, soaking up concentrated sunlight through long days — summer, with the year's longest day. Around December 21, the winter solstice, it leans farthest away, getting weak, slanted light and short days — winter. And around March 20 and September 22, the equinoxes, Earth's tilt points neither toward nor away from the Sun but sideways to it, so day and night are nearly equal in length almost everywhere on the planet.
Because the two hemispheres always lean in opposite directions, they get opposite seasons at the same time: when the Northern Hemisphere is basking in July summer, the Southern Hemisphere is bundled up in winter, which is exactly why it's warm in New York when it's cold in Australia. This same steady tilt gives most of the planet its yearly rhythm of growing seasons, migrations, and long summer evenings versus short winter afternoons — all of it flowing from one 23.5° lean that never changes direction.
Earth's axis is tilted relative to its orbital plane and keeps approximately the same orientation during a yearly orbit. When a hemisphere tilts toward the Sun it receives more direct sunlight and longer days, producing summer conditions.
Distance from the Sun is not the main cause of Earth's seasons. The hemispheres have opposite seasons at the same time even though they share nearly the same Sun distance. This observation helps test competing explanations.
Distinguish sunlight per unit area from total hours of daylight. Both contribute to seasonal energy input, along with clouds and surface conditions. A lamp-and-globe model can illustrate geometry but should not exaggerate changing axis direction during the orbit.
Build your understanding
Plan three teaching sessions: core explanation and Parts 1–2; Parts 3–4 with diagrams and reasoning checks; then the whole-unit application, worked examples, independent practice, and exit check. Read one part at a time, explain it without notes, and revisit any gap. Allow about 40–50 minutes per session; adjust after checking understanding.
Part 1 · Define tilt relative to the orbital plane
Earth’s rotation axis is tilted about 23.5° from the perpendicular to its orbital plane. Over one yearly orbit, its direction remains approximately fixed in space, so the Northern Hemisphere is oriented toward the Sun in one part of the orbit and away six months later. Rotation creates day and night; revolution around the Sun changes the seasonal geometry when combined with tilt. Redrawing the axis toward the Sun at every position would incorrectly keep one hemisphere always tilted toward it. The real orbit and Earth sizes cannot be represented faithfully together on this page.
Read the visual model
Compare the parallel red axes at opposite orbital positions. Which northern pole points more toward the central Sun depends on position, not a redrawn axis direction.
What would be wrong with rotating the axis in the drawing so the North Pole faced the Sun at both positions?
Visual reasoning — after your attempt
It would erase the change from tilted-toward to tilted-away geometry that explains opposite half-year seasons. The axis stays approximately fixed over the model year.
Earth’s rotation axis is tilted relative to the perpendicular to its orbital plane. Its orientation is approximately maintained over one yearly orbit. Rotation gives day/night; orbital position combined with axial tilt gives the seasonal pattern. Keep the reference direction explicit so a diagram does not confuse tilt with a changing orbit angle.
Four seasonal-position drawings should keep the axis pointing approximately the same way. Tilting it toward the Sun at all four positions invents a different motion and prevents a correct explanation.
Pause and explain
Why should the axis not be redrawn toward the Sun at every orbital position?
Check your reasoning after answering
Its orientation remains approximately fixed over the yearly orbit, producing changing hemispheric solar geometry.
Part 2 · Connect solar angle and day length to energy
A higher solar elevation spreads an equal incoming beam over a smaller ground area, increasing energy per area under matched conditions. A longer daylight interval also provides more time for absorption. The hemisphere tilted toward the Sun generally receives both effects together during its summer. Reflection, clouds, surface heat capacity and energy losses determine the actual temperature response, so geometric advantage is not a fixed thermometer reading. When calculating energy, keep rate, receiving area and time separate rather than treating a bright moment as a full-day total.
Read the visual model
The beam footprint indicates spreading at lower angle. The diagram isolates angle while the adjoining prose adds the independent daylight-duration effect.
If the same absorbed power per area continued for 12 rather than 8 hours, what factor would the received energy change by?
Visual reasoning — after your attempt
12/8 = 1.5 under the same-power assumptions. Actual daily power varies with angle, clouds and other conditions, so a real daily total needs that changing record.
A hemisphere tilted toward the Sun receives generally higher solar angles and longer daylight. Higher angles concentrate energy over less surface area; longer daylight increases the receiving interval. Both influence heating, while reflection, weather and heat storage affect actual temperature.
Use two equal-energy flashlight beams and compare illuminated area. Then distinguish that angle effect from the additional energy associated with a longer daily exposure.
Pause and explain
What two geometric effects favor summer heating in the tilted-toward hemisphere?
Check your reasoning after answering
Higher Sun angles and longer daylight, subject to other surface and atmospheric conditions.
Part 3 · Explain opposite hemispheric seasons
At the same moment, Earth has one Sun distance while northern and southern hemispheres have opposite tilt geometry. One receives longer/more direct seasonal sunlight while the other receives shorter/lower-angle sunlight. This makes opposite seasonal patterns a strong challenge to distance as the main explanation. Earth’s orbit is slightly elliptical, but its changing distance does not produce the opposite hemisphere seasons by itself. The supplied daylight values are an illustrative matched-latitude comparison, not exact values for every city or a guarantee of local climate.
Read the visual model
Compare June and December pairs under one shared planet-to-Sun distance at each date. The bars measure daylight duration rather than actual temperature.
Why would “Earth is nearer the Sun, so both hemispheres have summer” fail to explain these pairs?
Visual reasoning — after your attempt
Both hemispheres share the same instantaneous distance but have opposite daylight/tilt effects. Axis orientation and latitude explain that contrast; distance alone does not.
When one hemisphere is tilted toward the Sun, the other is tilted away. Their seasonal geometry is opposite even though both are on the same planet at the same Earth–Sun distance. Earth’s varying orbital distance is therefore not the main cause of this opposite seasonal pattern.
At one orbital position, label each hemisphere’s angle and day length. Ask how a distance-only explanation could give opposite seasons simultaneously; it cannot account for that evidence by itself.
Optional guided lab · Explain opposite seasons with one Earth
Optional guided lab · Explain opposite seasons with one Earth
Optional external exploration — WeduLab. Complete the local explanation first. The task and practice record here are independently written for this course. Choose this in place of comparable practice or allow extra time; it does not add a required session to the year plan.
Predict: if two places are at 40° north and 40° south, which has the higher noon Sun near the June solstice? Solar altitude means the Sun’s angle above the horizon; 0° is the horizon and 90° is directly overhead. Sketch the tilted axis and incoming sunlight.
Explore for about 15–20 minutes after studying tilt. In Earth Motion compare June, December and an equinox, using the day-length and noon-solar-altitude topics. Keep each location’s latitude fixed while changing date. Record the date, hemisphere, noon altitude and whether daylight is longer or shorter than night in the simplified model. If the interface cannot set your latitude exactly, record the actual latitude it uses.
The orbit drawing, Sun size and axis are visualization choices, not a scale model. The table is an original geometric calculation using a 23.4° solstitial solar declination, not observed local weather. The model omits atmospheric refraction, solar-disk size and topographic horizons; real sunrise-to-sunset intervals need not be exactly 12 hours at the equinox.
No-lab route: the original supplied record below contains everything needed for the question. It is not measured evidence collected from WeduLab. Label any separate observations you collect as simulation output, with settings and date.
| Date in simplified model | Solar declination / degrees | Noon altitude at 40° N | Noon altitude at 40° S |
|---|---|---|---|
| March equinox | 0.0 | 50.0° | 50.0° |
| June solstice | +23.4 | 73.4° | 26.6° |
| December solstice | −23.4 | 26.6° | 73.4° |
Question 1
Use noon altitude = 90° − |latitude − solar declination|, with south negative, to check the June row. Explain why Earth–Sun distance alone cannot explain opposite seasons. Give one reason maximum local air temperature need not occur on the solstice.
Worked solution and marking guidance
At 40° N in June, 90 − |40 − 23.4| = 73.4°. At 40° S, 90 − |−40 − 23.4| = 26.6°.
The hemispheres share essentially the same Earth–Sun distance on the same date but have different solar angles and daylight durations because of tilt.
Land, water and air store and transfer energy over time; temperature also depends on clouds, circulation and local conditions.
The June noon Sun is higher at 40° N. Tilt changes both illumination angle and daylight duration in opposite ways across the hemispheres. Seasonal temperature response can lag the solstice; the diagram is not a local temperature forecast.
- Use signed latitude and distinguish angle from temperature.
- Connect tilt to both solar angle and daylight duration.
- Explain a limit of the geometric model and avoid claiming an exactly 12-hour observed equinox day.
Pause and explain
What observation strongly challenges distance as the main seasonal cause?
Check your reasoning after answering
Opposite seasons in the hemispheres at the same Earth–Sun distance.
Part 4 · Interpret solstices, equinoxes and temperature lag
A solstice marks an extreme in seasonal solar geometry; an equinox marks the approximate equal-day/night geometry, with local qualifications. Neither date requires the warmest or coldest surface temperature to occur instantly. Land, ocean and atmosphere store energy, and temperature can keep rising while input exceeds losses even after peak input has passed. This delayed response is a lag. The two illustrative indices compare timing only; they are not directly additive because input and temperature are different quantities. Heat storage and exchanges can make lags differ between places.
Read the visual model
Find the earlier input-index peak and later response-index peak. The example highlights time order, not equality of physical units.
Why can temperature continue to increase after the input rate has begun decreasing?
Visual reasoning — after your attempt
If input still exceeds energy losses, stored energy can continue increasing. Temperature responds to the net accumulated balance and material properties, not only the momentary maximum input rate.
Solstices mark extreme seasonal solar geometry; equinoxes have roughly balanced day/night geometry globally, with local observational qualifications. Temperature need not peak on the longest day because land, ocean and atmosphere store and release energy over time. Explain a lag as an energy-balance response, not a change in axis direction.
A coast can warm more slowly than nearby inland terrain because water exchanges and stores energy differently. Geometry supplies a forcing; local energy processes shape the observed response.
Pause and explain
Why can the warmest period occur after the longest day?
Check your reasoning after answering
Stored energy and changing gains/losses create a delayed temperature response.
Apply the whole unit · Correct a seasons explanation
Illustrative claim: northern summer occurs because Earth is closer to the Sun, and the warmest day must be the June solstice.
Your task
Use a labeled annual-orbit model and an energy explanation to evaluate both claims; identify hemisphere and limits of any predicted local temperature.
What your response should show
- Use the supplied evidence accurately and label units or locations.
- Explain a physical mechanism or evidence-to-claim relationship.
- Show calculations or a clearly labeled model when the task calls for one.
- Identify a meaningful assumption, uncertainty, or competing explanation.
Response guidance — after your attempt
Axial tilt changes angle/day length and accounts for opposite seasons. Heat storage and weather prevent an exact peak-temperature date from geometry alone. Distance affects energy but does not explain the main hemispheric seasonal contrast.
Scientific references and adapted source material
Parent / teacher teaching notes
Check axis direction in all four positions and ask the learner to explain both angle and duration. Avoid evaluating a diagram solely by artistic resemblance. Ask the learner to explain each visual label and causal step before calculating. Preserve a first model, attempt the changed independent case, then use feedback to revise. Diagrams state whether values are illustrative or observed. Selected OpenSciEd excerpts are middle-school source material used for supported foundations; the independent high-school explanations and supplements are not the complete OpenSciEd teacher editions or an endorsement.
Animation of Earth orbiting the Sun with its axis tilted at a fixed 23.5° angle, showing the Northern and Southern Hemispheres alternating between leaning toward and away from direct sunlight.
The key idea
Earth's 23.5° axial tilt — not its distance from the Sun — determines the seasons, by changing how directly sunlight strikes each hemisphere throughout the year.
Worked examples
Example 1
- June 21 marks the summer solstice.
- On this date, Earth's fixed tilt points the Northern Hemisphere most directly toward the Sun.
- More direct sunlight plus longer daylight hours means it's the warmest, longest-day season.
Example 2 · Worked application
- Northern sunlight is more direct and days generally longer.
- Southern sunlight is less direct and days generally shorter at corresponding latitudes.
Seasons oppose across hemispheres despite sharing Earth's Sun distance.
Example 3
- December 21 is when the Northern Hemisphere tilts farthest away from the Sun (its winter solstice).
- Because Earth's tilt direction is fixed in space, when the Northern Hemisphere tilts away, the Southern Hemisphere tilts toward the Sun at the very same time.
- More direct sunlight and longer days in the Southern Hemisphere mean it's summer there.
Example 4
- The Southern Hemisphere tilts toward the Sun while the Northern Hemisphere tilts away.
- This changes illumination angle and day length in opposite ways.
Example 5 · Find and fix the mistake
- Test the claim against the stated conditions: Seasons oppose across hemispheres despite sharing Earth's Sun distance.
- Axial tilt and resulting sunlight angle/day length are the main seasonal cause; opposite hemispheric seasons contradict that explanation.
Seasons oppose across hemispheres despite sharing Earth's Sun distance.
Example 6 · Reason from the visual evidence
- Compare June and December pairs under one shared planet-to-Sun distance at each date. The bars measure daylight duration rather than actual temperature.
- Both hemispheres share the same instantaneous distance but have opposite daylight/tilt effects. Axis orientation and latitude explain that contrast; distance alone does not.
Original illustrative paired-hemisphere daylight durations for conceptual comparison. Exact values depend on latitude, date and horizon/refraction conventions. The chosen matched-latitude example isolates seasonal geometry rather than supplying a local almanac.
Avoid these mistakes
- Earth's axis does not reverse its tilt direction every season.
Check your understanding
Why can Australia have summer when New York has winter?
Discuss the answer
Opposite seasonal sunlight patterns arise from axial tilt, not separate Sun distances.
How does a lower Sun angle spread the same incoming beam over more surface area?
Discuss the answer
At a lower solar angle, the same incoming beam spans a larger ground footprint, giving less energy per area under matched conditions. Day length and reflection/storage are separate contributors to actual heating.
Return to the phenomenon
Return to the initial case. Why do Australia and New York have opposite seasons at the same time? Revise your drawing or explanation using two named ideas and one stated limitation.
Compare explanations after your attempt
Opposite tilt geometry changes solar angle and day length at one shared Earth–Sun distance. Surface energy storage can delay temperature peaks, so distance-only or instantaneous-temperature explanations are incomplete.
What should we investigate next?
Which comparison would test a remaining uncertainty? State what you would change, keep comparable and measure.
Investigate, explain and revise
Complete the tasks after studying the visual parts. Keep the first model and explain a revision before consulting the guidance.
Activity 1 · Explain the opening case
Use this unit’s opening record, Parts 1–4 and your notebook model. No external equipment or text is required for this supplied-data route.
Your task
Return to the initial case. Why do Australia and New York have opposite seasons at the same time? Revise your drawing or explanation using two named ideas and one stated limitation.
Success criteria
- Use two stated observations or conditions.
- Connect the mechanism to a labeled diagram or calculation.
- Identify what your original model missed.
- State a useful further test and a limitation.
Hint
Name the quantities and interactions before assigning a cause.
Response guidance — discuss after your attempt
Opposite tilt geometry changes solar angle and day length at one shared Earth–Sun distance. Surface energy storage can delay temperature peaks, so distance-only or instantaneous-temperature explanations are incomplete.
Activity 2 · Transfer to a changed case
Use the figures, captions and vocabulary in this unit; cover the worked answer.
Your task
Under a simple comparison, two surfaces receive equal absorbed power per square metre, but one receives it for 9 hours and the other 15. Compare energy received and explain why this still does not uniquely fix their temperatures.
Success criteria
- Use the stated measurements or conditions, with correct units.
- Connect the result to the physical mechanism or evidence relationship.
- Identify the assumption, model limit or further evidence requested.
Hint
Separate measured values, calculated results and model assumptions.
Response guidance — discuss after your attempt
The second receives 15/9 = 5/3, about 1.67 times the energy per area under the assumptions. Temperature also depends on heat capacity, mass, losses, prior conditions and varying real radiation.
Words to know
- axis
- The imaginary line Earth spins around, running through the North and South Poles.
- tilt
- The 23.5° lean of Earth's axis away from vertical, relative to its orbital plane.
- solstice
- One of two days a year (around June 21 and December 21) when a hemisphere is angled most directly toward or away from the Sun, giving the year's longest or shortest day.
- equinox
- One of two days a year (around March 20 and September 22) when Earth's tilt is sideways to the Sun, so day and night are roughly equal length nearly everywhere.
Earth's axis wobbles too — over 26,000 years
Beyond its 23.5° tilt, Earth's axis itself slowly traces a big circle in the sky over about 26,000 years, wobbling like a slowing spinning top — a motion called axial precession. Because of it, the star we call the North Star hasn't always been Polaris: around 3000 BCE, ancient Egyptians navigated by a star called Thuban, and in about 12,000 years the 'North Star' title will belong to the bright star Vega. Precession doesn't change the tilt angle that causes the seasons, but it slowly shifts which direction that tilt points relative to the distant stars.
The earliest sunset isn't on the shortest day
Here's a fact that surprises most people: the earliest sunset of the year in the Northern Hemisphere happens about two weeks before the winter solstice, not on it — and the latest sunrise happens about two weeks after the solstice. This odd mismatch happens because clock time and true solar time drift apart slightly across the year, an effect caused by combining Earth's axial tilt with its slightly elliptical orbit (charted on a figure-eight graph astronomers call the analemma). The solstice still marks the shortest total daylight — it's just not perfectly centered between the earliest sunset and latest sunrise.
Why the hottest day of summer isn't the solstice
If direct sunlight peaks on the summer solstice around June 21, why is late July or early August usually the hottest stretch of the year? The answer is seasonal lag: land and especially water absorb and release heat slowly, so Earth's surface and oceans keep accumulating extra heat for weeks after the solstice, even as daily sunlight is already starting to decrease. The same lag works in reverse in winter — the coldest days typically arrive in January, weeks after the shortest day in December, because the ground and ocean take time to fully lose their stored summer heat.
Midnight sun and total darkness: the tilt taken to its extreme
Earth's tilt has an extreme consequence right at the poles: regions inside the Arctic Circle and Antarctic Circle experience at least one day each year with 24 straight hours of sunlight (the 'midnight sun') and at least one day with 24 straight hours of darkness. Locally, the same tilt shows up more subtly — at Westchester County's latitude (about 41°N), day length swings from roughly 9 hours in late December to about 15 hours in late June, a difference of a full 6 hours that students can notice just by tracking sunset times across the school year.
In the real world
Farmers plan planting and harvest dates around the length of the growing season, which depends on how directly the Sun's rays hit their hemisphere at different times of the year.
Exit check
Why do the hemispheres have opposite seasons at the same Earth–Sun distance?
Check your explanation after answering
Earth’s axial tilt produces opposite changes in sunlight angle and daylight duration in the two hemispheres. Distance cannot explain opposite seasons at the same time.
Explain your reasoning without notes. If a key idea is missing, revisit the lesson and try again.
The Solar System
Learning goals
- I can list the eight planets in order from the Sun and classify each as terrestrial, gas giant, or ice giant.
- I can use astronomical units (AU) to compare distances in the solar system.
- I can distinguish asteroids, comets, meteoroids, meteors, and meteorites.
Readings for this unit
Before this unit
Distinguish planets, moons, asteroids and comets.
Plan three teaching sessions: core explanation and Parts 1–2; Parts 3–4 with diagrams and reasoning checks; then the whole-unit application, worked examples, independent practice, and exit check. Read one part at a time, explain it without notes, and revisit any gap. Allow about 40–50 minutes per session; adjust after checking understanding. Trace and explain the labeled figures in each part. In the third session, complete the illustrated case and changed independent application; retain a corrected explanation rather than only an answer.
Start with something to explain
What can an image of a distant world tell us, and what does it leave unknown?
Illustrative evidence case. A selected distance chart gives AU scales, while instruments can return images, spectra or samples with different information.
Notice and wonder
Record two observations using the stated quantities or relationships. Keep observations separate from possible causes. Write one question that a new measurement could help answer.
What can an image of a distant world tell us, and what does it leave unknown?
Your first model
Separate object diameter, orbital distance and evidence types; state one testable inference and one unknown.
Build the language from the idea
- astronomical unit (AU)
- A distance unit equal to the average distance from Earth to the Sun, about 93 million miles (150 million km); used to keep solar system distances easy to compare.
- terrestrial planet
- One of the four small, dense, rocky inner planets — Mercury, Venus, Earth, or Mars.
- gas giant
- One of the two huge outer planets, Jupiter or Saturn, made mostly of hydrogen and helium gas.
- asteroid
- A small, rocky object orbiting the Sun, most commonly found in the asteroid belt between Mars and Jupiter.
Our solar system is organized by two things at once — how far each planet orbits from the Sun, and what it's made of — and the two turn out to be neatly connected. The four planets closest in are the terrestrial planets — Mercury, Venus, Earth, and Mars — small, dense, rocky worlds with solid surfaces you could (in principle) stand on, and few or no moons. Then comes the asteroid belt, a ring of rocky debris, and just past it the planets change character completely.
Beyond the belt orbit the two gas giants, Jupiter and Saturn — colossal planets made mostly of hydrogen and helium, wrapped in rings and circled by dozens of moons each. Farther still are the two ice giants, Uranus and Neptune, built from icy materials like water, ammonia, and methane mixed with hydrogen and helium. Why the sharp split between little rocky worlds and giant gassy ones? Scientists think it's because the newborn Sun was so hot that close in, only rock and metal could survive to clump into planets while gases boiled away — but far from the Sun, in the deep cold, planets could gather and hold onto enormous envelopes of gas and ice, so they grew huge.
Distances out here are so staggering that ordinary miles and kilometers become almost useless — the numbers are just too big to picture. So astronomers use a shortcut called the astronomical unit (AU): 1 AU is simply the average distance from Earth to the Sun, about 93 million miles (150 million km). Now the whole solar system fits into tidy, comparable numbers — Mars orbits at about 1.5 AU, while distant Neptune crawls around at about 30 AU, that is, thirty times farther from the Sun than we are. It's a bit like measuring a road trip in 'days of driving' instead of writing out every single mile.
For all the attention the planets get, they are almost a rounding error next to the Sun, which holds about 99.8% of all the mass in the solar system — every planet, moon, and speck of rock combined makes up the leftover sliver. Beyond the eight planets orbit dwarf planets like Pluto and Ceres, plus countless smaller bodies. Asteroids are small, rocky objects, most of them circling in the asteroid belt between Mars and Jupiter, left over from the solar system's construction. Comets are icy bodies from the frigid outer solar system; when one swings close to the Sun, some of its ice vaporizes and streams out into the long, glowing tail we can sometimes see from Earth.
Finally, there's a handy little vocabulary chain that trips people up, all describing the same object at different moments. A meteoroid is a small chunk of rock drifting through space. If it plunges into Earth's atmosphere, it heats up until it's glowing white-hot and blazes across the sky as a meteor — the streak we call a 'shooting star.' And if any piece of it survives that fiery plunge and thuds onto the ground, that surviving rock is a meteorite. Knowing how these pieces fit together — the scale of the AU, the makeup of each planet, the debris drifting between them — is what lets scientists plan missions across those enormous distances and understand our own place in the neighborhood.
The solar system formed from a disk of material around the young Sun. Temperature and the available materials contributed to differences between inner rocky planets and outer giant planets. This is a model supported by observations, not a claim that every planetary system must be identical.
A planet's surface and atmosphere reflect interacting factors including gravity, temperature, composition and history. Size alone does not determine habitability. Compare measurements such as atmospheric pressure and liquid-water conditions rather than relying on one label.
Model scale carefully: a diagram that makes planet sizes visible usually compresses their separations. Read whether size and distance use the same scale. Distinguish astronomical units for solar-system distances from light-years used for much larger distances.
Build your understanding
Plan three teaching sessions: core explanation and Parts 1–2; Parts 3–4 with diagrams and reasoning checks; then the whole-unit application, worked examples, independent practice, and exit check. Read one part at a time, explain it without notes, and revisit any gap. Allow about 40–50 minutes per session; adjust after checking understanding.
Part 1 · Use distance and size as different scales
An astronomical unit, or AU, is a distance unit based on Earth’s mean Sun-distance scale, approximately 150 million kilometres. Orbital distance can be represented by a semimajor axis or by instantaneous Sun separation; state which is being used. Planets are very small compared with their separations, so a readable page usually exaggerates their dots. Jupiter’s large diameter and its distance from the Sun are different measurements. A diagram that fits planets tightly together with visible surfaces is often a montage, not a common physical size-and-distance scale.
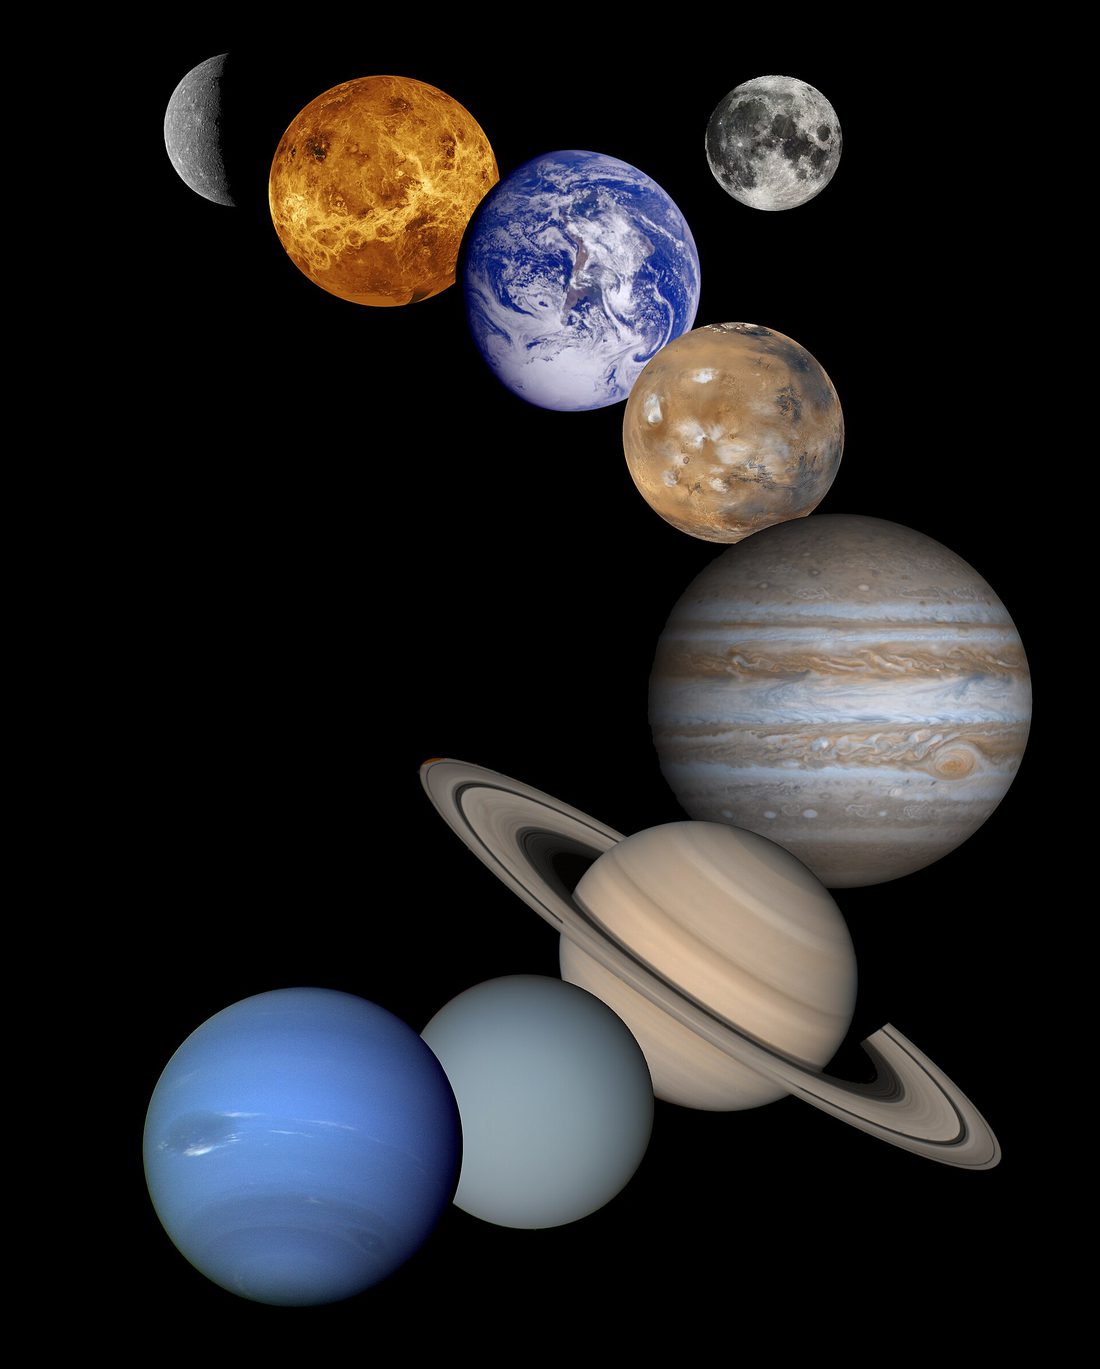
Read the visual model
Read the selected labeled mean distances against the same linear AU scale. Earth’s label is offset below its near-Sun dot rather than implying a large radius.
Why could a scale showing realistic planet diameters make the distances impossible to fit on a normal page?
Visual reasoning — after your attempt
Diameters are tiny relative to orbital separations. Separate scales preserve readability while clearly stating which quantity each view represents.
Solar-system objects differ greatly in size and separation. A diagram fitting both to one page often distorts one or both. Astronomical units describe orbital distances relative to Earth’s mean Sun distance; they are not object sizes. State whether distances use orbital radius, semimajor axis or instantaneous separation.
A bead model can show relative sizes while a separate long-distance model shows separations. Label the two scales instead of drawing planets apparently touching adjacent orbits.
Pause and explain
Why are separate size and distance scales often useful?
Check your reasoning after answering
The actual proportions are too large to show both clearly on a small diagram.
Part 2 · Explain composition and structure through formation
In a forming solar system, gas and dust occupy a rotating disk. Condensation here means formation of solid material from gases under suitable conditions, not only water droplets. Temperature differences influence which materials can remain as solids, contributing to rocky and volatile-rich building materials. Accretion gathers those materials into bodies. Large planets can retain and accumulate substantial gas, while migration, collisions and changing disk conditions alter later histories. Present distance alone therefore cannot uniquely determine composition, atmosphere or a planet’s full formation story.
Read the visual model
The disk is a process model rather than an actual observed image of the early Solar System. Read each condition/history link separately.
Why should “farther from the Sun” alone not be used as a complete explanation of every planetary property?
Visual reasoning — after your attempt
Materials, growth history, gas retention, migration, impacts and later evolution also matter. Distance helps describe conditions but is not the only cause.
A disk of early gas and dust supported accretion. Temperature and material availability differed with location, influencing what could condense and accumulate. Terrestrial and giant planets reflect different histories, while migration and later impacts complicate a simple distance-only explanation of every property.
Compare rocky surfaces with giant-planet envelopes using actual properties. Being farther away alone does not prove a particular atmosphere or present temperature without composition and energy evidence.
Pause and explain
Why should planetary properties not be inferred from distance alone?
Check your reasoning after answering
Composition, atmosphere, mass, formation and later history also affect them.
Part 3 · Distinguish planets, moons and small bodies
A moon orbits a larger body, while planets and many smaller bodies orbit the Sun under different classification criteria. Asteroids and comets preserve diverse histories and compositions. When a comet approaches the Sun, heating can release gas and dust. Solar radiation and the solar wind influence tail directions; an ion tail tends to point away from the Sun, while a dust tail can curve along a different geometry. A tail need not trail directly behind the comet’s velocity. Activity is an observation to explain, not a criterion that every distant icy body must always show a tail.
Read the visual model
The blue motion arrow and green away-from-Sun tail arrow point in different directions. The tail is one selected ion-tail direction, not a universal dust-tail shape.
Why can a comet tail fail to point behind its direction of travel?
Visual reasoning — after your attempt
Solar wind/radiation affect released material, so tail direction depends on the Sun and material type as well as the orbit. An ion tail points broadly away from the Sun.
Classification depends on orbital and physical criteria, not importance or attractiveness. Moons orbit larger bodies; asteroids, comets and other small bodies preserve different materials and histories. A tail depends on comet activity and solar effects, not simply the direction the object travels.
A comet’s material response near the Sun can produce different tails. Avoid drawing every tail as a trail behind a car; identify sunlight and solar-wind influences in the model.
Pause and explain
Why can a comet tail fail to point behind its direction of travel?
Check your reasoning after answering
Solar radiation and solar-wind effects influence tail orientation rather than travel direction alone.
Part 4 · Use missions as evidence with limits
An image records appearance in specified wavelengths, a spectrum records light–matter interactions and a returned sample permits direct material tests. These observations can complement one another but are not interchangeable. Habitability concerns conditions potentially compatible with life as considered in the model; evidence of water can support one such condition without proving organisms existed. Internal composition, age and biological origin require appropriate evidence and tests of alternatives. State the measurement, its uncertainties and the inference scope before interpreting a dramatic image as a complete history.
Read the visual model
The panels identify measurement types rather than rank them by scientific importance. Connect each to the property it can constrain.
Would a surface image interpreted as an ancient water channel directly prove living organisms were there?
Visual reasoning — after your attempt
No. It can support a geological water-related interpretation with qualifications. Evidence of biological activity needs additional tests and alternative explanations.
Images, spectra, gravitational measurements and samples provide different kinds of evidence. Surface appearance alone does not establish internal composition, exact age or habitability. Compare observations with models and distinguish the conditions needed for a phenomenon from proof that it actually occurs there.
Evidence of past water-related minerals can support a past interaction without establishing present life. Name the observation and the narrower conclusion before extending an interpretation.
Pause and explain
Does evidence of past water automatically demonstrate living organisms?
Check your reasoning after answering
No. It supports water-related conditions; life requires additional evidence.
Apply the whole unit · A two-scale solar-system model
Illustrative model scale: Earth’s mean orbital distance is 1 AU and represented by 10 cm. Three bodies have distances 0.5, 2 and 5 AU.
Your task
Place the bodies at scaled distances, explain why bead diameter needs a separate stated scale, and identify two limitations of the linear display.
What your response should show
- Use the supplied evidence accurately and label units or locations.
- Explain a physical mechanism or evidence-to-claim relationship.
- Show calculations or a clearly labeled model when the task calls for one.
- Identify a meaningful assumption, uncertainty, or competing explanation.
Response guidance — after your attempt
Distances are 5, 20 and 50 cm from the Sun under the stated mean-distance scale. Bead sizes require another scale; a line omits orbital geometry, changing positions and many size/separation ratios. Do not confuse AU with a body’s diameter.
Scientific references and adapted source material
Parent / teacher teaching notes
Ask the learner to state what each measurement represents. Retain the assigned reference table for actual planetary data and use clear source dates rather than memorize every measurement. Ask the learner to explain each visual label and causal step before calculating. Preserve a first model, attempt the changed independent case, then use feedback to revise. Diagrams state whether values are illustrative or observed. Selected OpenSciEd excerpts are middle-school source material used for supported foundations; the independent high-school explanations and supplements are not the complete OpenSciEd teacher editions or an endorsement.
Animation of the Sun at the center with the eight planets — Mercury, Venus, Earth, Mars, Jupiter, Saturn, Uranus, and Neptune — orbiting at increasing distances.
The key idea
The solar system is organized by distance and composition — rocky terrestrial planets close in, gas and ice giants farther out — and astronomical units (AU) keep its huge distances easy to compare.
Astronomical Unit (AU) Conversion
distance (miles) = distance (AU) × 93,000,000
1 AU ≈ 93 million miles (150 million km), the average Earth–Sun distance; multiply to convert AU to miles, divide to convert miles back to AU.
Worked examples
Example 1
- To compare the two distances, divide Mars's distance by Earth's distance.
- 1.5 AU ÷ 1 AU = 1.5.
Example 2 · Worked application
- Rocky planets have substantial solid surfaces and high-density materials.
- Gas giants contain large gaseous/fluid envelopes and differ in structure.
- Use actual data for mass, radius and atmosphere instead of size alone.
Larger radius alone does not determine greater mean density.
Example 3
- Multiply Neptune's distance in AU by the number of miles in 1 AU.
- 30 × 93 million miles = 2,790 million miles.
Example 4
- One AU corresponds to 1 m in this model.
- Multiply 5 AU by 1 m/AU.
Example 5 · Find and fix the mistake
- Test the claim against the stated conditions: Larger radius alone does not determine greater mean density.
- Planets orbit the Sun; moons orbit their primary bodies while also traveling with them around the Sun.
Larger radius alone does not determine greater mean density.
Example 6 · Reason from the visual evidence
- The blue motion arrow and green away-from-Sun tail arrow point in different directions. The tail is one selected ion-tail direction, not a universal dust-tail shape.
- Solar wind/radiation affect released material, so tail direction depends on the Sun and material type as well as the orbit. An ion tail points broadly away from the Sun.
Original qualitative comet/planet/moon scene with exaggerated body sizes and one selected ion-tail direction. It is not a real encounter image or simultaneous orbital-position map. The caption distinguishes the ion-tail example from possible curved dust-tail geometry.
Avoid these mistakes
- A classroom solar-system drawing is rarely to scale in both sizes and separations.
Check your understanding
A model places Earth 1 m from the Sun. At the same distance scale, a planet at 5 AU is how far away?
Discuss the answer
5 m from the model Sun; planet-size scale may still differ.
Why does planetary habitability require more evidence than distance from the Sun alone?
Discuss the answer
Distance influences conditions but does not uniquely determine atmosphere, composition, energy sources, geological history or biology. Evidence for one suitable condition, such as water, does not prove life.
Return to the phenomenon
Return to the initial case. What can an image of a distant world tell us, and what does it leave unknown? Revise your drawing or explanation using two named ideas and one stated limitation.
Compare explanations after your attempt
Solar-system diagrams often use different size/distance scales. Formation and later history influence properties, and mission measurements constrain selected questions. Water-related conditions alone are not proof of life.
What should we investigate next?
Which comparison would test a remaining uncertainty? State what you would change, keep comparable and measure.
Investigate, explain and revise
Complete the tasks after studying the visual parts. Keep the first model and explain a revision before consulting the guidance.
Activity 1 · Explain the opening case
Use this unit’s opening record, Parts 1–4 and your notebook model. No external equipment or text is required for this supplied-data route.
Your task
Return to the initial case. What can an image of a distant world tell us, and what does it leave unknown? Revise your drawing or explanation using two named ideas and one stated limitation.
Success criteria
- Use two stated observations or conditions.
- Connect the mechanism to a labeled diagram or calculation.
- Identify what your original model missed.
- State a useful further test and a limitation.
Hint
Name the quantities and interactions before assigning a cause.
Response guidance — discuss after your attempt
Solar-system diagrams often use different size/distance scales. Formation and later history influence properties, and mission measurements constrain selected questions. Water-related conditions alone are not proof of life.
Activity 2 · Transfer to a changed case
Use the figures, captions and vocabulary in this unit; cover the worked answer.
Your task
A Solar System distance model places a body at a = 10 AU. Convert that scale to kilometres using 1 AU ≈ 150 million km. Explain why the distance and an image of a water-related feature do not alone establish its size or life.
Success criteria
- Use the stated measurements or conditions, with correct units.
- Connect the result to the physical mechanism or evidence relationship.
- Identify the assumption, model limit or further evidence requested.
Hint
Separate measured values, calculated results and model assumptions.
Response guidance — discuss after your attempt
The scale is about 1.5 billion km. It is an orbital distance, not a diameter. A water-related surface interpretation concerns geological conditions and does not alone prove organisms or all habitability requirements.
Words to know
- astronomical unit (AU)
- A distance unit equal to the average distance from Earth to the Sun, about 93 million miles (150 million km); used to keep solar system distances easy to compare.
- terrestrial planet
- One of the four small, dense, rocky inner planets — Mercury, Venus, Earth, or Mars.
- gas giant
- One of the two huge outer planets, Jupiter or Saturn, made mostly of hydrogen and helium gas.
- asteroid
- A small, rocky object orbiting the Sun, most commonly found in the asteroid belt between Mars and Jupiter.
Kepler's laws: orbits aren't just circles at constant speed
In the early 1600s, German astronomer Johannes Kepler analyzed decades of precise observations and discovered that planetary orbits are actually slight ellipses, not perfect circles, with the Sun sitting off-center at one focus. He also found that a planet sweeps out equal areas of its orbit in equal times — meaning every planet moves faster when it's closer to the Sun and slower when it's farther away. His third law revealed a precise mathematical relationship between a planet's orbital period and its distance from the Sun (period squared is proportional to distance cubed), a relationship still used today to calculate the orbits of newly discovered objects.
Born from a spinning cloud: the solar nebula theory
About 4.6 billion years ago, the entire solar system began as a single enormous, slowly rotating cloud of gas and dust that collapsed under its own gravity, forming the Sun at the dense center while the leftover material flattened into a spinning disk — explaining why every planet still orbits in roughly the same plane, in the same direction. Beyond an invisible boundary called the frost line, temperatures were cold enough for ices to solidify, letting the outer planets accumulate huge amounts of material and grow into gas and ice giants, while the inner planets, too close and warm for ice to survive, stayed small and rocky.
The vote that cost Pluto its planet status
Pluto was considered the solar system's ninth planet from its discovery in 1930 until 2006, when astronomers started finding other icy, Pluto-sized worlds even farther out in the Kuiper Belt — including Eris, which is nearly as large as Pluto. Rather than declare dozens of new 'planets,' the International Astronomical Union voted in 2006 on a formal definition requiring a true planet to have gravitationally 'cleared its neighborhood' of other debris — a test Pluto fails, since it shares its orbital region with countless other Kuiper Belt objects. That reclassified Pluto as a dwarf planet, a decision still debated by some astronomers today.
If the Sun were a basketball
The distances described by astronomical units are so vast they're hard to picture, so try this scale model: shrink the Sun down to the size of a basketball. On that scale, Earth would be a peppercorn sitting about 30 yards away, Jupiter would be a golf ball roughly 150 yards out, and Neptune — at 30 AU — would sit almost half a mile from the basketball Sun. And the next-nearest star beyond our solar system, at that same scale, would be roughly 4,000 miles away — a vivid reminder of just how empty and enormous space really is.
In the real world
Mission planners at NASA use AU-scale distances and orbital timing to launch spacecraft toward Mars only during the few-week launch windows that occur roughly every 26 months, when Earth and Mars line up for the shortest possible trip.
Exit check
Compare terrestrial planets with giant planets using composition and location.
Check your explanation after answering
The inner terrestrial planets have rocky surfaces and relatively small sizes. Jupiter and Saturn are gas giants; Uranus and Neptune are ice giants with different compositions. All four giant planets orbit farther from the Sun than the terrestrial planets.
Explain your reasoning without notes. If a key idea is missing, revisit the lesson and try again.
Gravity, Orbits & Tides
Learning goals
- I can describe gravity as an attractive force that depends on mass and distance.
- I can explain how gravity and inertia combine to create an orbit.
- I can explain why Earth has two tides a day and what causes spring tides and neap tides.
Readings for this unit
Before this unit
Distinguish velocity direction from force direction.
Plan three teaching sessions: core explanation and Parts 1–2; Parts 3–4 with diagrams and reasoning checks; then the whole-unit application, worked examples, independent practice, and exit check. Read one part at a time, explain it without notes, and revisit any gap. Allow about 40–50 minutes per session; adjust after checking understanding. Trace and explain the labeled figures in each part. In the third session, complete the illustrated case and changed independent application; retain a corrected explanation rather than only an answer.
Start with something to explain
Why can a body accelerate at constant speed, and why are there two ideal tidal bulges?
Illustrative evidence case. In an ideal circular orbit, speed is constant but direction changes. Moonward gravitational acceleration differs between Earth’s near side, center and far side.
Notice and wonder
Record two observations using the stated quantities or relationships. Keep observations separate from possible causes. Write one question that a new measurement could help answer.
Why can a body accelerate at constant speed, and why are there two ideal tidal bulges?
Your first model
Draw velocity separately from force, then compare tidal accelerations relative to Earth’s center.
Build the language from the idea
- gravity
- The attractive force every object with mass exerts on every other object with mass; stronger with more mass, weaker (quickly) with more distance.
- orbit
- A curved path under gravity; the net inward force changes the direction of motion. Inertia is not an outward force.
- tide
- The regular rise and fall of ocean water levels, caused mainly by the Moon's gravity, with a smaller contribution from the Sun.
- spring tide & neap tide
- Spring tides have a larger typical tidal range near new/full phases when lunar and solar tidal axes align; neap tides have a smaller range near quarter phases when those axes are roughly perpendicular. Local coast/basin dynamics modify the actual tides.
Gravity attracts masses. At fixed masses its magnitude follows an inverse-square dependence on separation: doubling distance reduces the force to one quarter. This describes force, not a guarantee about the resulting orbital path.
An orbiting object has velocity while gravity continually changes that velocity. In a circular orbit, the net acceleration points inward even when speed is constant. Inertia is the tendency to maintain velocity, not an outward force balancing gravity. With no gravity, a satellite would initially move along a tangent rather than follow the same circle.
Tides arise from differences in gravitational effects across Earth, mainly due to the Moon and also the Sun. Alignment near new and full moon produces a larger tidal range (spring tides); roughly right-angle geometry near quarter moons produces a smaller range (neap tides). Spring does not refer to the season.
A simple model predicts two tidal bulges, but coastlines, ocean depth, and basin response affect local tides. Many locations have two highs and two lows per lunar day (about 24 hours 50 minutes); others have one or unequal tides. Use local observations rather than assuming every shore follows an identical schedule.
An orbiting body continuously accelerates toward the attracting body while moving tangentially. Gravity changes the direction of velocity; it is not balanced away by a real outward force in an inertial description. An orbit is a continuing fall around the central body.
Gravity weakens with increasing separation and increases with the interacting masses. In the same central-body system, more distant circular orbits generally take longer. A model must state assumptions such as circular path and negligible effects from other bodies.
Tides arise from differences in gravitational pull across Earth, principally from the Moon and also the Sun. Coastlines, ocean depth and local dynamics affect actual tidal patterns. A simple two-bulge diagram is useful for introductory geometry but does not predict every coastal tide time.
Build your understanding
Plan three teaching sessions: core explanation and Parts 1–2; Parts 3–4 with diagrams and reasoning checks; then the whole-unit application, worked examples, independent practice, and exit check. Read one part at a time, explain it without notes, and revisit any gap. Allow about 40–50 minutes per session; adjust after checking understanding.
Part 1 · Separate mass, weight and gravitational force
Mass describes inertia and amount of material; weight is gravitational force in the stated setting. For point masses or suitable spherical approximations, gravitational force is proportional to the product of masses and inversely proportional to the square of center-to-center separation. Doubling distance at fixed masses gives 1/4 of the force. Doubling one mass at the same time gives 2/4 = 1/2. A satellite’s height above Earth is not the full separation: include Earth’s radius. These ratios describe force under assumptions, not a complete new orbit trajectory.
Read the visual model
Read separation as a ratio of distances between centers. The plotted values are selected inverse-square points, with a guide connecting them.
If separation triples and one mass doubles while the other stays fixed, what is the force factor?
Visual reasoning — after your attempt
2/3² = 2/9 of the original under the stated point/spherical-mass assumptions.
Mass measures inertia/material amount; weight is gravitational force in a stated setting. Gravity acts between masses and decreases with squared separation for ideal point masses or suitable spherical approximations. Distance in that relation is between centers, not a height above the surface alone.
At fixed masses, doubling center-to-center distance reduces force to one quarter. Doubling one mass doubles force; changing two variables needs both factors accounted for.
Pause and explain
If separation doubles and one mass doubles, what is the force factor?
Check your reasoning after answering
2 × 1/4 = 1/2 of the original under the stated model.
Part 2 · Explain an orbit with velocity and acceleration
Velocity includes direction as well as speed. In an ideal circular orbit, velocity is tangent to the path while net acceleration points inward. Gravity supplies the force needed for this direction change. Inertia is a tendency to retain velocity, not an extra outward force canceling gravity. If gravity vanished at one instant in the ideal model, the body would initially continue along the tangent instead of continuing around the circle. If tangential velocity vanished instead, the same circular trajectory would not persist. Keep velocity and force arrows labeled separately.
Read the visual model
The blue arrow is motion/velocity at one instant; the red arrow is inward gravity/acceleration. Their lengths have different units and scales.
Why is the orbiting body accelerating even when its speed stays constant?
Visual reasoning — after your attempt
Its velocity direction changes continuously. Acceleration concerns change in velocity, not only an increase in speed.
An orbiting object has velocity while gravity changes its direction and possibly speed. In a circular ideal orbit, acceleration points inward while speed remains constant. Inertia is not an outward force that cancels gravity. If gravity vanished, the ideal instantaneous motion would continue along the tangent rather than stay circular.
Draw a velocity arrow tangent to the path and an acceleration arrow toward the central body. Arrows describe different quantities; keeping speed constant does not mean acceleration is zero.
Pause and explain
How can an object accelerate without increasing its speed?
Check your reasoning after answering
Changing velocity direction is acceleration even at constant speed.
Part 3 · Explain tides as differential gravitational effects
The Moon attracts all parts of Earth, but the near side experiences stronger lunar gravitational acceleration than Earth’s center and the far side weaker. Compare each location with the center’s acceleration in a frame moving with Earth: the relative effects stretch along the Earth–Moon line. The Sun also contributes tidal effects. Near new and full phase, their tidal axes align, producing a larger typical range, called spring tides; near quarter phase they are roughly perpendicular, giving neap tides. This compares tidal effects, not merely whether total gravitational forces point the same way.
Read the visual model
All red lunar-attraction arrows point toward the Moon, with different magnitudes. The far-side bulge is not drawn as lunar gravity pulling away from the Moon.
How can the far-side relative effect be outward from Earth’s center while lunar gravity there still points toward the Moon?
Visual reasoning — after your attempt
The far side accelerates toward the Moon less than Earth’s center does. In the Earth-following comparison, that difference is away from the center, while the actual lunar attraction remains Moonward.
Tides involve differences in gravitational attraction across Earth together with the Earth–Moon system’s motion. The Moon contributes strongly; the Sun also contributes. Local coast shape, basin depth and other factors influence actual tide patterns. A two-bulge diagram is simplified rather than an exact map of coastal water level.
Spring/neap patterns refer to combined Sun–Moon geometry, not weather seasons. Alignments can reinforce the tidal range; approximate right-angle geometry can reduce it, subject to local response.
Pause and explain
Why does a global tide model not predict every harbor’s exact tide?
Check your reasoning after answering
Local basin and coastal dynamics modify timing and range beyond the simple model.
Part 4 · Identify assumptions in mathematical explanations
A simple two-bulge equilibrium model isolates tidal geometry, but oceans cannot instantaneously assume its shape around all land. Coastlines, depths, resonances, rotation and local dynamics affect actual timing and range. Some places have two highs and lows in a lunar day, others one or unequal patterns. The lunar day is about 24 hours 50 minutes on average; it is different from the roughly 29.5-day phase cycle. For actual local timing, use location-specific tide observations or suitable predictions rather than reading a global bulge picture as an hourly harbor chart.
Read the visual model
The different local curves are supplied examples, not exact astronomical predictions. Compare timing and range rather than expecting identical peaks everywhere.
Why does a gravitational-force ratio alone fail to determine a full local tide curve or satellite orbit?
Visual reasoning — after your attempt
Motion and response also depend on initial conditions, geometry, interacting forces, basin dynamics and model assumptions. A force magnitude ratio is only one part of the problem.
A force formula, circular orbit model and tidal diagram answer related but different questions. State fixed quantities, central-body mass and neglected influences. Actual systems can include elliptical motion and multiple gravitational effects. A correct force ratio alone does not determine an entire new orbital path.
If radius is changed, the speed needed for a circular orbit also changes. Do not conclude that a spacecraft retains the same orbit solely because a force has been reduced by a known factor.
Pause and explain
Why is a gravitational-force ratio insufficient to predict a full orbit?
Check your reasoning after answering
The trajectory also depends on velocity, direction, mass distribution and other influences.
Apply the whole unit · Three diagrams, three claims
Illustrative tasks: force at twice the original separation; a satellite’s direction if gravity is removed instantaneously; Sun–Moon geometry for larger versus smaller tidal range.
Your task
Calculate the force ratio and draw the two motion/tide models. Label quantities and state one limitation for each model.
What your response should show
- Use the supplied evidence accurately and label units or locations.
- Explain a physical mechanism or evidence-to-claim relationship.
- Show calculations or a clearly labeled model when the task calls for one.
- Identify a meaningful assumption, uncertainty, or competing explanation.
Response guidance — after your attempt
Force is one quarter at fixed masses; ideal motion after removal follows the instantaneous tangent; aligned Sun–Moon geometry can reinforce tidal range, while near-right-angle geometry reduces it. Each result has stated assumptions; local tides require more evidence.
Scientific references and adapted source material
Parent / teacher teaching notes
Have the learner draw velocity and acceleration separately. Correct any outward-inertia-force claim and require the model’s center-distance definition before calculation. Ask the learner to explain each visual label and causal step before calculating. Preserve a first model, attempt the changed independent case, then use feedback to revise. Diagrams state whether values are illustrative or observed. Selected OpenSciEd excerpts are middle-school source material used for supported foundations; the independent high-school explanations and supplements are not the complete OpenSciEd teacher editions or an endorsement.
The key idea
Gravity supplies the net force that curves orbital motion. Differences in lunar and solar gravitational effects across Earth produce tides; local coastlines shape the observed pattern.
Worked examples
Example 1
- Velocity includes direction as well as speed.
- The satellite’s direction changes continuously.
- Gravity provides the inward net force required for that acceleration.
Example 2 · Worked application
- Its tangential velocity carries it forward.
- Gravity continuously changes its direction toward the center.
- The combination produces orbital free fall.
Being in orbit does not mean gravity is absent.
Example 3
- Velocity includes direction as well as speed.
- A changing velocity direction means acceleration, directed inward in the circular model.
Example 4 · Find and fix the mistake
- Test the claim against the stated conditions: Being in orbit does not mean gravity is absent.
- Orbiting objects and occupants are in free fall; gravity remains essential to orbital motion.
Being in orbit does not mean gravity is absent.
Example 5 · Reason from the visual evidence
- All red lunar-attraction arrows point toward the Moon, with different magnitudes. The far-side bulge is not drawn as lunar gravity pulling away from the Moon.
- The far side accelerates toward the Moon less than Earth’s center does. In the Earth-following comparison, that difference is away from the center, while the actual lunar attraction remains Moonward.
Original exaggerated equilibrium-tide geometry. Red arrows represent relative sizes of Moonward lunar acceleration at selected Earth positions, not actual force values. The elongated outline summarizes an ideal two-bulge model; real coastal tides depend on rotation, basins, coastlines and dynamics.
Avoid these mistakes
- Gravity in an orbit is not canceled by an equal outward force.
Check your understanding
An orbiting satellite moves at constant speed but continually changes direction. Is it accelerating?
Discuss the answer
Yes; gravitational acceleration changes its direction of motion.
Why does a simple tidal-bulge drawing not predict every harbor's tide times?
Discuss the answer
Coastline shape, basin depth, resonance, rotation and local dynamics alter timing/range. The ideal two-bulge geometry does not replace location-specific records or tide predictions.
Return to the phenomenon
Return to the initial case. Why can a body accelerate at constant speed, and why are there two ideal tidal bulges? Revise your drawing or explanation using two named ideas and one stated limitation.
Compare explanations after your attempt
Gravity changes orbital velocity direction without an outward inertia force. Tidal relative effects arise from differences across Earth even though lunar attraction is Moonward everywhere; local ocean dynamics modify the ideal bulge response.
What should we investigate next?
Which comparison would test a remaining uncertainty? State what you would change, keep comparable and measure.
Investigate, explain and revise
Complete the tasks after studying the visual parts. Keep the first model and explain a revision before consulting the guidance.
Activity 1 · Explain the opening case
Use this unit’s opening record, Parts 1–4 and your notebook model. No external equipment or text is required for this supplied-data route.
Your task
Return to the initial case. Why can a body accelerate at constant speed, and why are there two ideal tidal bulges? Revise your drawing or explanation using two named ideas and one stated limitation.
Success criteria
- Use two stated observations or conditions.
- Connect the mechanism to a labeled diagram or calculation.
- Identify what your original model missed.
- State a useful further test and a limitation.
Hint
Name the quantities and interactions before assigning a cause.
Response guidance — discuss after your attempt
Gravity changes orbital velocity direction without an outward inertia force. Tidal relative effects arise from differences across Earth even though lunar attraction is Moonward everywhere; local ocean dynamics modify the ideal bulge response.
Activity 2 · Transfer to a changed case
Use the figures, captions and vocabulary in this unit; cover the worked answer.
Your task
At fixed central mass, a satellite’s center separation doubles while its mass triples. Find the gravitational-force factor. Explain why this does not uniquely give the new orbit or period.
Success criteria
- Use the stated measurements or conditions, with correct units.
- Connect the result to the physical mechanism or evidence relationship.
- Identify the assumption, model limit or further evidence requested.
Hint
Separate measured values, calculated results and model assumptions.
Response guidance — discuss after your attempt
The force factor is 3/2² = 3/4. A trajectory also needs velocity/initial conditions and an appropriate orbital model; force ratio alone does not define an entire new orbit.
Words to know
- gravity
- The attractive force every object with mass exerts on every other object with mass; stronger with more mass, weaker (quickly) with more distance.
- orbit
- A curved path under gravity; the net inward force changes the direction of motion. Inertia is not an outward force.
- tide
- The regular rise and fall of ocean water levels, caused mainly by the Moon's gravity, with a smaller contribution from the Sun.
- spring tide & neap tide
- Spring tides have a larger typical tidal range near new/full phases when lunar and solar tidal axes align; neap tides have a smaller range near quarter phases when those axes are roughly perpendicular. Local coast/basin dynamics modify the actual tides.
The actual math behind 'more mass, less distance'
Isaac Newton's law of universal gravitation puts exact numbers behind the qualitative rule in this lesson: the force of gravity between two objects equals a constant (G) multiplied by both masses, divided by the distance between them squared (F = Gm₁m₂/r²). That squared term matters enormously — doubling the distance between two objects doesn't cut the gravitational force in half, it cuts it to one-quarter; tripling the distance cuts it to one-ninth. This 'inverse-square' relationship is why gravity, while never technically reaching zero, becomes almost undetectably weak over large distances very quickly.
The falling apple that (maybe) connected heaven and Earth
According to a story Newton himself told late in life, watching an apple fall in his mother's orchard around 1666 sparked the realization that the very same force pulling the apple straight down might also be the force constantly pulling the Moon toward Earth, bending its path into an orbit instead of a straight line. Whether the apple story is literally true or exaggerated over time, Newton's real achievement was proving mathematically that one single force — gravity — governs both a falling apple on Earth and the Moon's motion through space, unifying 'earthly' and 'heavenly' physics for the first time in history.
Einstein's twist: gravity as bent space, not just a pulling force
Newton's gravity equation works incredibly well for almost every everyday and even planetary situation, but in 1915 Albert Einstein proposed something stranger in his general theory of relativity: gravity isn't really a force reaching out between two masses at all, but the effect of massive objects curving the very fabric of space and time around them, so that other objects simply follow the straightest possible path through that curved space. Einstein's theory correctly predicted a tiny, leftover wobble in Mercury's orbit that Newton's equations couldn't fully explain — proof that even a 300-year-old, extremely successful theory can still be refined.
Astronauts aren't 'escaping' gravity — they're falling
It's a common misconception that astronauts aboard the International Space Station float because they've escaped Earth's gravity. In reality, gravity at the ISS's orbital altitude is still about 90% as strong as gravity at Earth's surface. Astronauts appear weightless because they — and their entire spacecraft — are in continuous freefall, constantly falling toward Earth but also moving forward fast enough that they perpetually miss it, tracing a circular path around the planet. An orbit, as this lesson describes, really is just a very long, very fast fall that never lands.
The Moon is drifting away — and lengthening our days
Tidal friction between Earth and the Moon doesn't just cause ocean tides — it's slowly transferring energy between the two bodies. Each year, the Moon spirals about 3.8 centimeters farther from Earth, a rate precisely measured using laser reflectors astronauts left on the lunar surface during the Apollo missions. As the Moon gains orbital energy and drifts outward, Earth's rotation gradually slows down in exchange, meaning Earth's days are actually getting very slightly longer over geologic time — hundreds of millions of years ago, a full day on Earth lasted under 22 hours.
In the real world
Coastal engineers, sailors, and clammers rely on tide tables — predicted from the Moon's and Sun's positions — to know exactly when harbors will be deep enough to navigate or mudflats will be exposed.
Exit check
Why is a satellite in circular orbit accelerating even at constant speed?
Check your explanation after answering
Its velocity direction changes continuously. Gravity supplies a net inward force and acceleration; inertia is not a balancing outward force.
Explain your reasoning without notes. If a key idea is missing, revisit the lesson and try again.
Predicting Orbits with Mathematical Models
Learning goals
- I can use the simplified relation P² = a³ for objects orbiting the Sun.
- I can explain why an orbit requires a net inward force rather than balanced forces.
Readings for this unit
Before this unit
Square and cube ratios and read the assumptions of a model.
Plan three teaching sessions: core explanation and Parts 1–2; Parts 3–4 with diagrams and reasoning checks; then the whole-unit application, worked examples, independent practice, and exit check. Read one part at a time, explain it without notes, and revisit any gap. Allow about 40–50 minutes per session; adjust after checking understanding. Trace and explain the labeled figures in each part. In the third session, complete the illustrated case and changed independent application; retain a corrected explanation rather than only an answer.
Start with something to explain
Why does doubling an orbit’s size not simply double its year?
Illustrative evidence case. The ideal solar model pairs a = 1, 4, 9, 16 AU with P = 1, 8, 27, 64 years.
Notice and wonder
Record two observations using the stated quantities or relationships. Keep observations separate from possible causes. Write one question that a new measurement could help answer.
Why does doubling an orbit’s size not simply double its year?
Your first model
Draw an ellipse with focus and axis labels, then compare raw and transformed variable plots.
Build the language from the idea
- semimajor axis
- Half the longest diameter of an ellipse.
- orbital period
- Time required for one complete orbit.
- astronomical unit
- A distance unit based on the Earth–Sun scale, about 150 million km.
An object in orbit continually changes the direction of its velocity. Gravity supplies a net inward acceleration. Inertia is the tendency to continue straight; it is not an outward force that balances gravity. For a circular orbit, speed can be constant even while velocity changes direction.
For an object orbiting the Sun, a useful model is P² = a³ when P is in Earth years and a is the semimajor axis in astronomical units. The semimajor axis describes the size of an elliptical orbit. In this approximation the orbiting object’s mass is small compared with the Sun’s. Other central bodies require a different constant.
The model predicts longer periods for larger orbits. It does not mean a planet travels at the same speed everywhere along an ellipse. It moves faster closer to the Sun and slower farther away. Check units and assumptions before using an equation; a mathematical relationship is a model with a domain of usefulness.
For objects orbiting the same dominant central mass, Kepler's relation connects period squared with orbital semimajor axis cubed. Use ratios to compare two orbits without finding the proportionality constant. The relation uses semimajor axis, not a random instantaneous separation.
Circular models simplify geometry; real orbits are often elliptical. Gravitational attraction acts continuously, and a body's speed can vary along an ellipse. A diagram's equal-time swept areas express that varying speed.
A prediction should use consistent units and be checked against available observations. If the central mass changes, the same period-distance constant does not automatically apply. Describe ignored interactions or measurement uncertainty before judging disagreement as a failure of all gravitational models.
Build your understanding
Plan three teaching sessions: core explanation and Parts 1–2; Parts 3–4 with diagrams and reasoning checks; then the whole-unit application, worked examples, independent practice, and exit check. Read one part at a time, explain it without notes, and revisit any gap. Allow about 40–50 minutes per session; adjust after checking understanding.
Part 1 · Read an ellipse without moving the Sun to its center
An ellipse is a curve with a constant sum of distances to its two foci. Its longest diameter is the major axis, and half of that is the semimajor axis, written a. In an ideal two-body planetary model, the Sun lies at one focus rather than at the geometric center. Distance from Sun to planet therefore changes around the orbit. A circle is a special case with coincident foci. Classroom ellipses often exaggerate eccentricity, the departure from a circle, to make the focus distinction visible; real planetary orbits can be much less elongated.
Read the visual model
Identify center, focus and axis separately. The Sun is offset toward one focus, not used as the ellipse center.
If the major axis is 10 AU, what is a, and is a the instantaneous Sun–planet distance at every position?
Visual reasoning — after your attempt
a = 5 AU. It describes orbit scale; instantaneous focus-to-planet distance varies in an elliptical orbit.
Kepler’s orbital model uses an ellipse with the Sun at one focus for a planet in the idealized system. A circle is a limiting special case. Semimajor axis describes the ellipse’s scale; instantaneous Sun–planet distance varies along the path. An exaggerated classroom ellipse may not resemble a planet’s actual eccentricity.
Label both foci, center and semimajor axis. The central body at a focus and the geometric center are different positions in an elliptical model.
Pause and explain
Why is placing the Sun at an ellipse’s center a model error?
Check your reasoning after answering
The ideal Kepler orbit has the Sun at a focus, except in the circular limit.
Part 2 · Relate area sweep to speed
Kepler’s equal-area relation says that the line from the central focus to the planet sweeps equal area in equal time intervals in the ideal two-body orbit. Nearer the Sun, a shorter radius must sweep a larger angle to cover comparable area, so the planet moves faster. Farther away, a longer radius can sweep the same area through a smaller angle, giving a shorter arc over that interval. The area relation is about the focus-to-body line, not sectors measured from the ellipse’s center. The shaded sectors here are constructed to have equal swept area; their orbital arcs have different lengths. The exaggerated ellipse makes this relation visible, but is not a named planet’s orbit.
Read the visual model
Compare the distance to the focus and how much orbital arc each equal-time record traverses. Do not equate wedge angle alone with area.
Why can equal swept area coexist with unequal distance traveled in the same time?
Visual reasoning — after your attempt
The focus radius differs along the orbit. Equal area with a shorter radius requires greater angular motion/arc speed than with a longer radius in the ideal model.
Equal areas swept in equal times describe how orbital position changes. A planet moves faster near its closer approach and slower farther away in the ideal model. Equal time does not imply equal arc length; distance from the focus affects the area swept.
Draw two equal-time wedges and compare their shapes. A narrow long-radius wedge and a wider short-radius wedge can have equal area with different travel distances.
Pause and explain
Does equal swept area require equal distance traveled in equal time?
Check your reasoning after answering
No. Orbital radius and geometry change, so speed can vary.
Part 3 · Use the period relation with the correct system
For suitable bodies orbiting the same dominant solar mass, the convenient units years and AU give P² = a³ in the ideal model. P is orbital period and a is semimajor axis. At a = 4 AU, a³ = 64, so P = 8 years. Doubling a from 4 to 8 would multiply period by √8, about 2.83, rather than simply two. The chosen units incorporate the solar-system constant; a body around a star with different mass needs a more general relation. Sparse connected points describe a curved underlying relation, not linear period growth.
Read the visual model
Read a on the horizontal axis and P vertically. Neither variable is instantaneous speed or planet diameter.
Find P when a = 9 AU in the supplied solar model.
Visual reasoning — after your attempt
P = √(9³) = √729 = 27 years. The relation assumes the same dominant solar mass and appropriate years/AU units.
For bodies orbiting the same dominant central mass under the appropriate assumptions, period squared is proportional to semimajor axis cubed. In years/AU for the ideal solar-system form, P² = a³. Comparing systems with different central masses requires a more general relation, not blindly reusing the same constant.
At a = 4 AU, P² = 64 years² and P = 8 years. Calculate the square root; do not report 64 years as the period.
Pause and explain
What is P when a = 9 AU in the ideal solar relation?
Check your reasoning after answering
P² = 9³ = 729 years²; taking the positive square root gives P = 27 years under the same-Sun, years/AU model. The squared period is not the period itself.
Part 4 · Test predictions and diagnose mismatch
A curved relationship can become easier to test when variables are transformed according to the model. Plotting P² against a³ should produce proportional values for the stated solar relation. Check units before comparing points; years² and AU³ encode the chosen constant. A mismatch can come from arithmetic, measurement uncertainty, a different central mass or additional interactions. It does not automatically refute gravity or imply an instrument is wrong. Identify the assumption most directly tested and compare independent observations.
Read the visual model
Both axes use transformed variables, unlike the previous raw period/axis plot. Squaring a and cubing P would test a different relation.
What is the transformed point for a = 4 AU and P = 8 years, and why is it useful?
Visual reasoning — after your attempt
(a³, P²) = (64, 64). It lies on the supplied solar proportional line, testing the relationship in matched transformed units.
A model prediction should specify variables, units and assumptions. Compare measured periods and axes with the relation and examine measurement uncertainty or other influences. A mismatch can indicate a calculation error, wrong units, wrong central mass or neglected interactions; it does not automatically abolish gravity.
An exoplanet orbiting another star may need that star’s mass in the calculation. State what new information is required before interpreting disagreement with the solar years/AU formula.
Pause and explain
Why might the solar-system constant fail for a planet around a different star?
Check your reasoning after answering
The central mass differs, changing the period–axis relationship.
Apply the whole unit · An orbital-model calculation and critique
Illustrative same-Sun systems: A has a = 1 AU, B has a = 4 AU. A learner claims B’s period is four years because its orbit is four times bigger.
Your task
Calculate both periods, explain the exponent relation, and identify two assumptions and one observation that would test the model.
What your response should show
- Use the supplied evidence accurately and label units or locations.
- Explain a physical mechanism or evidence-to-claim relationship.
- Show calculations or a clearly labeled model when the task calls for one.
- Identify a meaningful assumption, uncertainty, or competing explanation.
Response guidance — after your attempt
A has P = 1 year; B has P = 8 years. Period scales with a to the 3/2 power, not linearly. Assume the same dominant central mass and compatible units/ideal orbital model; compare observed period and semimajor axis, with uncertainty.
Scientific references and adapted source material
Parent / teacher teaching notes
Teach powers and square roots using explicit units, then ask for an independent example. Keep semimajor axis, instantaneous radius and geometric center distinct. Ask the learner to explain each visual label and causal step before calculating. Preserve a first model, attempt the changed independent case, then use feedback to revise. Diagrams state whether values are illustrative or observed. Selected OpenSciEd excerpts are middle-school source material used for supported foundations; the independent high-school explanations and supplements are not the complete OpenSciEd teacher editions or an endorsement.
The key idea
Gravity provides inward acceleration; orbital period and orbital size follow a predictable relationship under stated assumptions.
Worked examples
Example 1
- P² = 4³ = 64.
- Take the positive square root.
Example 2 · Worked application
- a³=4³=64.
- P=√64=8 years.
The relation requires the stated units and central mass.
Example 3
- T² scales with a³, so the squared period ratio is 4³=64.
- Take the square root: T_B/T_A=8.
Example 4 · Find and fix the mistake
- Test the claim against the stated conditions: The relation requires the stated units and central mass.
- For the same central mass, P scales as a to the 3/2 power, not linearly.
The relation requires the stated units and central mass.
Example 5 · Reason from the visual evidence
- Read a on the horizontal axis and P vertically. Neither variable is instantaneous speed or planet diameter.
- P = √(9³) = √729 = 27 years. The relation assumes the same dominant solar mass and appropriate years/AU units.
Original graph of the chapter’s supplied ideal solar-system records. The points follow P² = a³; straight connecting guides do not replace the smooth underlying curve. It is not a dataset of four named planets and is not valid with the same constant for arbitrary central masses.
Avoid these mistakes
- Do not apply one central mass's period-distance constant to a different system.
Check your understanding
For the same star, orbit B has semimajor axis 4 times A's. What is its period ratio?
Discuss the answer
Orbit B's period is 8 times orbit A's under this model.
Why is the same central mass an important condition in this comparison?
Discuss the answer
The period–semimajor-axis proportional constant depends on the dominant central mass. P² = a³ in years/AU is the convenient ideal solar form, not the same numerical relation for every star.
Return to the phenomenon
Return to the initial case. Why does doubling an orbit’s size not simply double its year? Revise your drawing or explanation using two named ideas and one stated limitation.
Compare explanations after your attempt
Orbital scale is semimajor axis and the Sun lies at a focus. The ideal solar relation P² = a³ gives nonlinear period growth, while equal-area motion explains speed changes along an elliptical orbit.
What should we investigate next?
Which comparison would test a remaining uncertainty? State what you would change, keep comparable and measure.
Investigate, explain and revise
Complete the tasks after studying the visual parts. Keep the first model and explain a revision before consulting the guidance.
Activity 1 · Explain the opening case
Use this unit’s opening record, Parts 1–4 and your notebook model. No external equipment or text is required for this supplied-data route.
Your task
Return to the initial case. Why does doubling an orbit’s size not simply double its year? Revise your drawing or explanation using two named ideas and one stated limitation.
Success criteria
- Use two stated observations or conditions.
- Connect the mechanism to a labeled diagram or calculation.
- Identify what your original model missed.
- State a useful further test and a limitation.
Hint
Name the quantities and interactions before assigning a cause.
Response guidance — discuss after your attempt
Orbital scale is semimajor axis and the Sun lies at a focus. The ideal solar relation P² = a³ gives nonlinear period growth, while equal-area motion explains speed changes along an elliptical orbit.
Activity 2 · Transfer to a changed case
Use the figures, captions and vocabulary in this unit; cover the worked answer.
Your task
In the ideal same-Sun model, a body has a = 6.25 AU. Find P and the transformed pair (a³, P²). Explain why the same numerical constant need not apply around another star.
Success criteria
- Use the stated measurements or conditions, with correct units.
- Connect the result to the physical mechanism or evidence relationship.
- Identify the assumption, model limit or further evidence requested.
Hint
Separate measured values, calculated results and model assumptions.
Response guidance — discuss after your attempt
a³ = 244.140625, so P = 15.625 years and the transformed pair is (244.140625 AU³, 244.140625 years²). The proportional constant depends on the dominant central mass; the convenient solar years/AU form is not universal.
Words to know
- semimajor axis
- Half the longest diameter of an ellipse.
- orbital period
- Time required for one complete orbit.
- astronomical unit
- A distance unit based on the Earth–Sun scale, about 150 million km.
In the real world
Exit check
Why can constant speed and acceleration coexist in an orbit?
Check your explanation after answering
Velocity includes direction. In a circular orbit direction changes even if speed is constant, so there is acceleration.
Explain your reasoning without notes. If a key idea is missing, revisit the lesson and try again.
Problem 1
Answer and explanation
Half of the Moon — whichever half faces the Sun — is always lit.
Just like Earth, the Moon is a sphere lit by the Sun on whichever half faces it at any moment. That's always exactly half of the Moon's surface. What changes is how much of that lit half faces Earth as the Moon orbits us, which is what creates the phases.
Problem 2
Answer and explanation
About 14-15 days
A full moon is roughly halfway through the 29.5-day cycle, and a new moon marks the start/end point. From full moon to the next new moon is the remaining half of the cycle: 29.5 ÷ 2 ≈ 14.75, so about 14-15 days.
Problem 3
Answer and explanation
A full moon is just the phase where we see the Moon's fully lit side; a lunar eclipse is the rarer event when Earth's shadow actually falls on the Moon.
Every month there's a full moon, when the Moon's entire sunlit half faces Earth. A lunar eclipse can only happen at full moon, but it additionally requires the Sun, Earth, and Moon to be almost perfectly lined up so Earth's shadow falls on the Moon. Since the Moon's orbit is tilted about 5° relative to Earth's orbit around the Sun, that precise alignment only happens a couple of times a year, not every month.
Problem 4
Answer and explanation
Summer
June 21 is the summer solstice. Earth's fixed tilt has the Northern Hemisphere leaning most directly toward the Sun on this date, giving it the most direct sunlight and the longest day of the year.
Problem 5
Answer and explanation
The same amount of energy is spread over a larger area at a low angle, so each patch of ground gets less energy.
Picture a flashlight beam hitting a wall straight-on versus at a steep sideways angle: straight-on, the light forms a small, bright, concentrated circle; at an angle, the same beam stretches into a larger, dimmer oval. Sunlight works the same way — direct, high-angle rays concentrate their energy over a small area, while indirect, low-angle rays spread that same energy over a bigger area, so each square meter of ground receives less heating.
Problem 6
Answer and explanation
Winter and short days in the Northern Hemisphere; summer and long days in the Southern Hemisphere.
December 21 is the Northern Hemisphere's winter solstice: Earth's tilt points the North Pole away from the Sun at this point in the orbit, so the Northern Hemisphere gets indirect sunlight and its shortest day. Since Earth's tilt direction is fixed in space, the Southern Hemisphere is tilted toward the Sun at the very same time, getting direct sunlight and its longest day — summer. The hemispheres always have opposite seasons for this reason.
Problem 7
Answer and explanation
Mercury, Venus, Earth, Mars
The four rocky, dense inner planets — closest to the Sun and separated from the outer planets by the asteroid belt — are Mercury, Venus, Earth, and Mars.
Problem 8
Answer and explanation
About 1.5 times farther
Divide Mars's distance by Earth's distance: 1.5 AU ÷ 1 AU = 1.5. So Mars orbits about 1.5 times farther from the Sun than Earth does.
Problem 9
Answer and explanation
About 0.2%
If the Sun holds 99.8% of the mass, everything else must make up the remaining share: 100% − 99.8% = 0.2%.
Problem 10
Answer and explanation
An attractive force between any two masses.
Gravity is the pulling force that every object with mass exerts on every other object with mass. It gets stronger when the masses are larger and weaker, quickly, as the distance between them increases.
Problem 11
Answer and explanation
Tidal effects depend on the difference in gravity across Earth, not just the total gravitational force. The nearby Moon has the larger tidal effect, while the Sun also contributes.
The Sun exerts a larger total gravitational force on Earth, but its gravitational field varies less across Earth relative to its total. The closer Moon produces the stronger tidal effect.
Problem 12
Answer and explanation
Neap tide
At first quarter (and also third quarter), the Moon is 90° away from the Sun as seen from Earth — the Sun, Earth, and Moon form a right angle instead of a straight line. The Sun's and Moon's gravitational pulls on Earth's oceans point in different directions and partly cancel each other out, producing a smaller-than-usual tidal range: a neap tide. Spring tides, with the biggest range, happen instead at new and full moon, when the Sun, Earth, and Moon line up and their pulls combine.
Problem 13
- getting smaller
- getting larger
- not visible
- always full
Answer and explanation
getting larger
Waxing means the lit fraction is increasing toward full.
Problem 14
Answer and explanation
Note which side is lit and the time of day it is visible. From the northern hemisphere a waxing moon is lit on the right and is visible in the evening sky after sunset, while a waning moon is lit on the left and is visible in the morning before sunrise. A single observation of both the lit side and the time therefore settles it.
Response criteria
- State a scientifically accurate conclusion.
- Show the data, mechanism, or calculation that supports it.
- Include units, conditions, or limits where relevant.
Problem 15
Answer and explanation
First quarter describes about one-quarter of the phase cycle and the visible disk is roughly half lit. New Moon alone does not guarantee a solar eclipse because the tilted lunar orbit usually misses the shadow line; alignment near a node is also needed.
First quarter describes about one-quarter of the phase cycle and the visible disk is roughly half lit. New Moon alone does not guarantee a solar eclipse because the tilted lunar orbit usually misses the shadow line; alignment near a node is also needed.
Response criteria
- Use the stated measurements or conditions, with correct units.
- Connect the result to the physical mechanism or evidence relationship.
- Identify the assumption, model limit or further evidence requested.
Problem 16
- northern
- southern
- both
- neither
Answer and explanation
northern
The northern hemisphere is tilted sunward, giving its longest day.
Problem 17
Answer and explanation
Earth is closest to the Sun in early January, when the northern hemisphere is in winter, so distance cannot be the cause. The decisive evidence is that the two hemispheres have opposite seasons at the same moment: a single Earth–Sun distance cannot produce summer in one place and winter in another, whereas the tilt explains it exactly.
Response criteria
- State a scientifically accurate conclusion.
- Show the data, mechanism, or calculation that supports it.
- Include units, conditions, or limits where relevant.
Problem 18
Answer and explanation
The second receives 15/9 = 5/3, about 1.67 times the energy per area under the assumptions. Temperature also depends on heat capacity, mass, losses, prior conditions and varying real radiation.
The second receives 15/9 = 5/3, about 1.67 times the energy per area under the assumptions. Temperature also depends on heat capacity, mass, losses, prior conditions and varying real radiation.
Response criteria
- Use the stated measurements or conditions, with correct units.
- Connect the result to the physical mechanism or evidence relationship.
- Identify the assumption, model limit or further evidence requested.
Problem 19
- Earth
- Jupiter
- The Sun
- The asteroid belt
Answer and explanation
The Sun
The Sun holds nearly all the system's mass and its gravity governs the orbits.
Problem 20
Answer and explanation
The distances are enormously larger than the objects: at a scale where Earth is a small bead, the Sun is metres away and Neptune is kilometres distant. A diagram that fits on a page must either exaggerate the planet sizes or compress the distances, so most do both. Saying which has been distorted is part of reading the model honestly.
Response criteria
- State a scientifically accurate conclusion.
- Show the data, mechanism, or calculation that supports it.
- Include units, conditions, or limits where relevant.
Problem 21
Answer and explanation
The scale is about 1.5 billion km. It is an orbital distance, not a diameter. A water-related surface interpretation concerns geological conditions and does not alone prove organisms or all habitability requirements.
The scale is about 1.5 billion km. It is an orbital distance, not a diameter. A water-related surface interpretation concerns geological conditions and does not alone prove organisms or all habitability requirements.
Response criteria
- Use the stated measurements or conditions, with correct units.
- Connect the result to the physical mechanism or evidence relationship.
- Identify the assumption, model limit or further evidence requested.
Problem 22
- aligned
- at right angles as seen from Earth
- both new
- closest
Answer and explanation
at right angles as seen from Earth
Their tidal effects partly cancel at first and third quarter.
Problem 23
Answer and explanation
On the near side the Moon's pull is strongest and draws water toward it. At Earth's centre the pull is intermediate, and on the far side it is weakest, so that water is effectively left behind as the solid Earth is pulled away from it. The result is a bulge on both sides, which is why most coasts experience two high tides as Earth rotates through them each day.
Response criteria
- State a scientifically accurate conclusion.
- Show the data, mechanism, or calculation that supports it.
- Include units, conditions, or limits where relevant.
Problem 24
Answer and explanation
The force factor is 3/2² = 3/4. A trajectory also needs velocity/initial conditions and an appropriate orbital model; force ratio alone does not define an entire new orbit.
Apply the mass factor 3 and separation-square factor 1/4.
Multiply to obtain 3/4.
Distinguish force ratio from full motion and request the needed initial/model conditions.
Response criteria
- Use the stated measurements or conditions, with correct units.
- Connect the result to the physical mechanism or evidence relationship.
- Identify the assumption, model limit or further evidence requested.
Problem 25
Answer and explanation
At 2 AU, P = √8 ≈ 2.83 years, so period does not scale linearly with orbital size.
Problem 26
Answer and explanation
a³ = 244.140625, so P = 15.625 years and the transformed pair is (244.140625 AU³, 244.140625 years²). The proportional constant depends on the dominant central mass; the convenient solar years/AU form is not universal.
Compute 6.25³ = 244.140625.
Take its square root: 15.625 years.
Keep transformed units and identify the central-mass assumption.
Response criteria
- Use the stated measurements or conditions, with correct units.
- Connect the result to the physical mechanism or evidence relationship.
- Identify the assumption, model limit or further evidence requested.