Waves, Sound & Light — Print · Physical Science: Matter, Forces & Energy, Grade 8
Connect vibrating sources, wave properties, sound, light and information with a complete source–medium–receiver model. This is a required chapter and is included in the course final.
Printable chapter lessons and review.
Sound Sources, Vibrations & Receivers
Learning goals
- I can read source vibration records and distinguish amplitude, frequency and pitch.
- I can explain energy transfer from a source through matter to a receiver and qualify a loudness prediction.
Readings for this unit
Before this unit
Review the earlier force and energy-transfer ideas. The visible language notes explain this unit’s quantities; then connect them to its concrete records and figure.
Use three teaching sessions of about 40–45 minutes: first observe the phenomenon, draft a model and study Parts 1–2; next explain Parts 3–4 with the figures and evidence; then work the application, examples, practice, model revision and exit check. Divide any difficult part into smaller steps and revisit after feedback. Investigations, review and quizzes have separate sessions. Study the four visual parts across the scheduled sessions, then use the illustrated worked case and independent transfer questions. Extend or revisit a session when the learner cannot explain the figure; completion time is a proposed allocation, not a mastery guarantee.
Start with something to explain
What would explain the observations in sound sources, vibrations & receivers?
Illustrative evidence case. Illustrative sources A/B/C have amplitudes 1/3/1 mm and complete 4/4/6 cycles respectively in 0.02 s.
Notice and wonder
Which source has the highest modeled pitch and which the largest amplitude? Write two observations from the supplied record without guessing their cause. Include a quantity and its unit when given. An observation is what was recorded; an inference is what you think explains it.
Write one question about why the pattern occurs and one question about a comparison that could distinguish competing explanations. A testable question identifies what could be observed or measured.
Your first model
Before reading the model answer, sketch the named objects or particles and label what you think changes. Compare frequency and amplitude and explain what a receiver prediction would need. Keep this first version so you can compare it with your later explanation.
Build the language from the idea
- vibration
- Repeated motion around a rest position.
- source
- Object initiating the sound disturbance.
- receiver
- Object or system responding to the arriving disturbance.
- amplitude
- Largest displacement from rest in the simple oscillation model.
- frequency
- Complete cycles per second, measured in hertz.
- model
- A representation that explains selected features and makes predictions; it leaves other details out.
- evidence
- Relevant observations or records used to support or challenge a claim.
- system boundary
- The chosen limit separating the objects being studied from their surroundings.
- assumption
- A condition taken as true for a model or calculation and needing to be checked against the case.
A ruler projecting from a table can make a sound when gently displaced and released; its tip moves back and forth. A vibration is repeated motion about a rest position.
A source is the vibrating object producing the disturbance, and a receiver is the object that responds elsewhere. Between them, sound ordinarily needs matter such as air.
Energy is transferred through the system; the ruler itself does not travel to an ear. Use quiet sounds or supplied data, and never increase volume to make a dramatic shaking effect.
Students who cannot hear a sound can study its visible motion and supplied vibration records.
An observation is what a person or instrument records. An inference is a proposed interpretation of those records. Keep the two separate: a graph can show a pattern while more than one mechanism might explain it. State the chosen system, or part of the world being studied, and its boundary before accounting for material or energy transfers.
Use each figure as a reasoning tool. Read its caption and labels, describe the pattern, then explain a cause. If the picture is schematic, use the stated numbers rather than measuring its printed size. Check whether its simplified conditions match the problem before applying a formula.
Build your understanding
Where this fits
This unit helps answer the chapter question: How do waves and circuits transfer energy and information? Keep a notebook table with the question, evidence, explanation and one unresolved issue. Revise a previous model only when you can name the new evidence or idea that changes it.
Use three teaching sessions of about 40–45 minutes: first observe the phenomenon, draft a model and study Parts 1–2; next explain Parts 3–4 with the figures and evidence; then work the application, examples, practice, model revision and exit check. Divide any difficult part into smaller steps and revisit after feedback. Investigations, review and quizzes have separate sessions.
Part 1 · Locate what moves at the source
A sound source may vibrate too quickly or through too small a distance for normal viewing. Visible slow-motion records or graphs can provide evidence. A source can move back and forth while its average location remains approximately the same. Rest position means the location around which it vibrates.
Read the visual model
Does no visible motion prove that a source is not vibrating?
Visual reasoning — after your attempt
No. The motion can be too fast or small to detect with the chosen method. A suitable measurement or record is needed.
A clean flexible ruler can be held gently against a table and plucked at low amplitude, away from faces. The protruding tip moves alternately above and below rest. Stop if the material is brittle; the supplied records are an equal alternative.
Pause and explain
Does no visible motion prove that a source is not vibrating?
Check your reasoning after answering
No. The motion can be too fast or small to detect with the chosen method. A suitable measurement or record is needed.
Part 2 · Compare amplitude without changing frequency silently
Amplitude is the greatest displacement from the rest position in the simple vibration model. Larger amplitude often corresponds to louder sound under comparable conditions. Loudness is a perception, not identical to a directly measured amplitude. The medium, distance and receiver also matter.
Read the visual model
A cycle is one complete repeat, such as one peak to the next matching peak. A taller trace does not automatically have more cycles. Compare amplitude and frequency one at a time rather than using the word louder for both.
Which record has a higher frequency? What quantity differs, and what additional labels are needed for a numerical amplitude?
Visual reasoning — after your attempt
Neither has a higher frequency in this matched window. Displacement amplitude differs; a numerical vertical position scale and units are needed to measure it.
Illustrative source A moves between +1 and −1 mm, while B moves between +3 and −3 mm. Both complete four cycles in 0.02 s. B has three times the displacement amplitude, but not three times the frequency.
Pause and explain
What is B’s amplitude and what quantity remains unchanged?
Check your reasoning after answering
Amplitude is 3 mm. The cycle count per time, and hence frequency of 200 Hz, is unchanged in this comparison.
Part 3 · Count complete cycles to explain pitch
Frequency is the number of complete cycles per second, measured in hertz, written Hz. A higher-frequency sound is generally perceived as higher pitch. Count a cycle from one repeated phase to the next, such as an upward rest crossing to the next upward crossing.
Read the visual model
Hertz (Hz) means cycles per second. Period is seconds per cycle. These are reciprocal descriptions of one repeat rate, while amplitude measures the size of the local displacement.
If the same source completed four cycles in this one-second window at the same peak displacement, which quantities would change?
Visual reasoning — after your attempt
Frequency would become 4 Hz and period 0.25 s. Amplitude would remain 2 mm; changing cycle rate need not change the displacement amplitude.
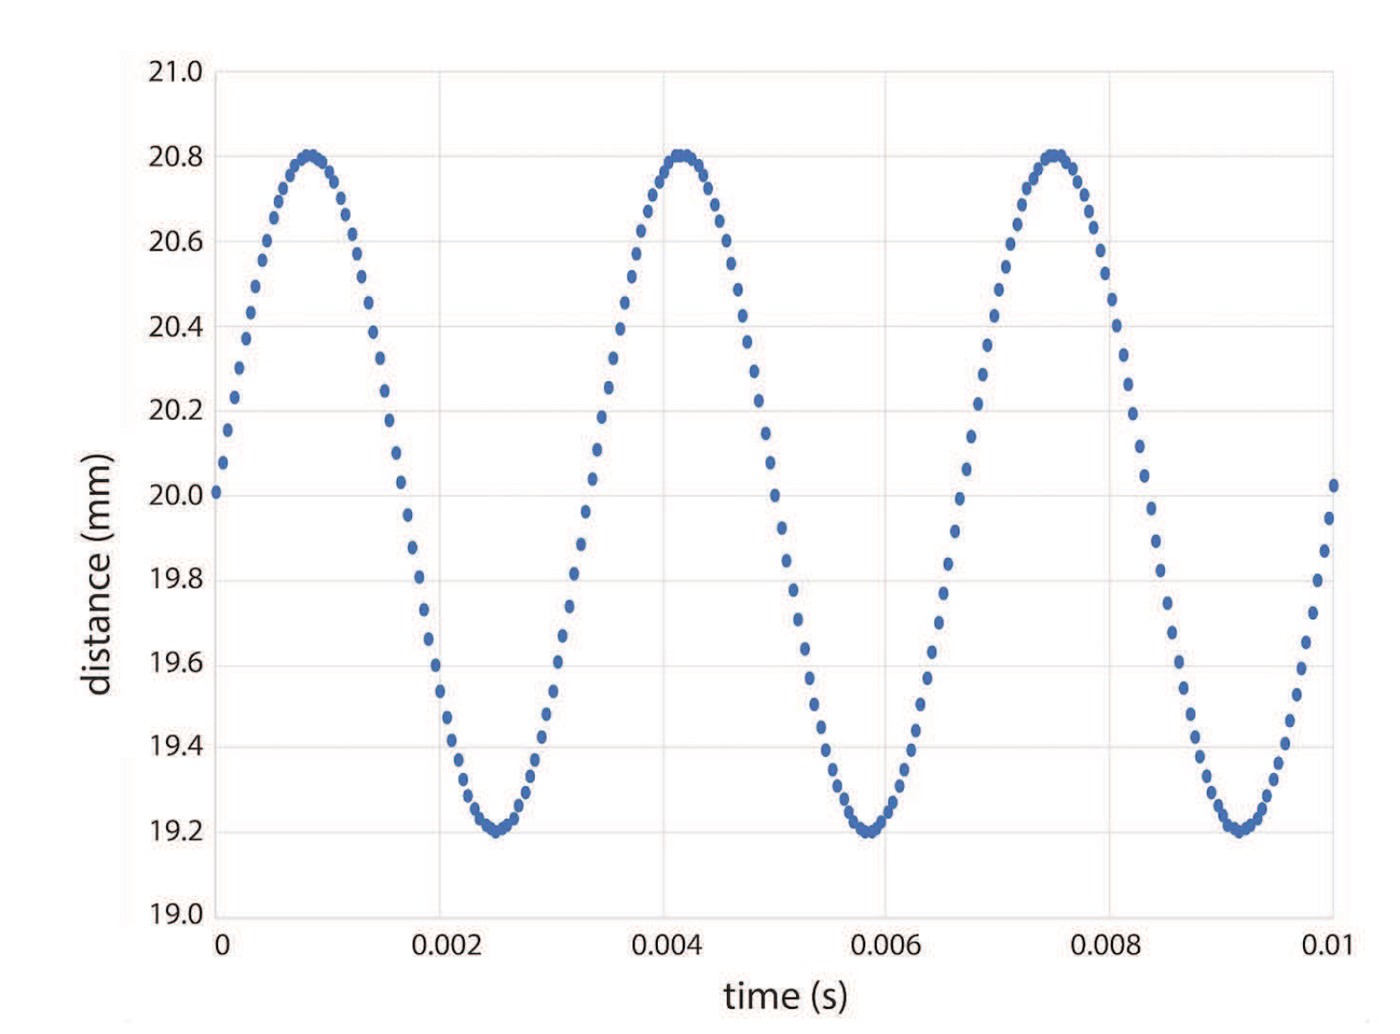
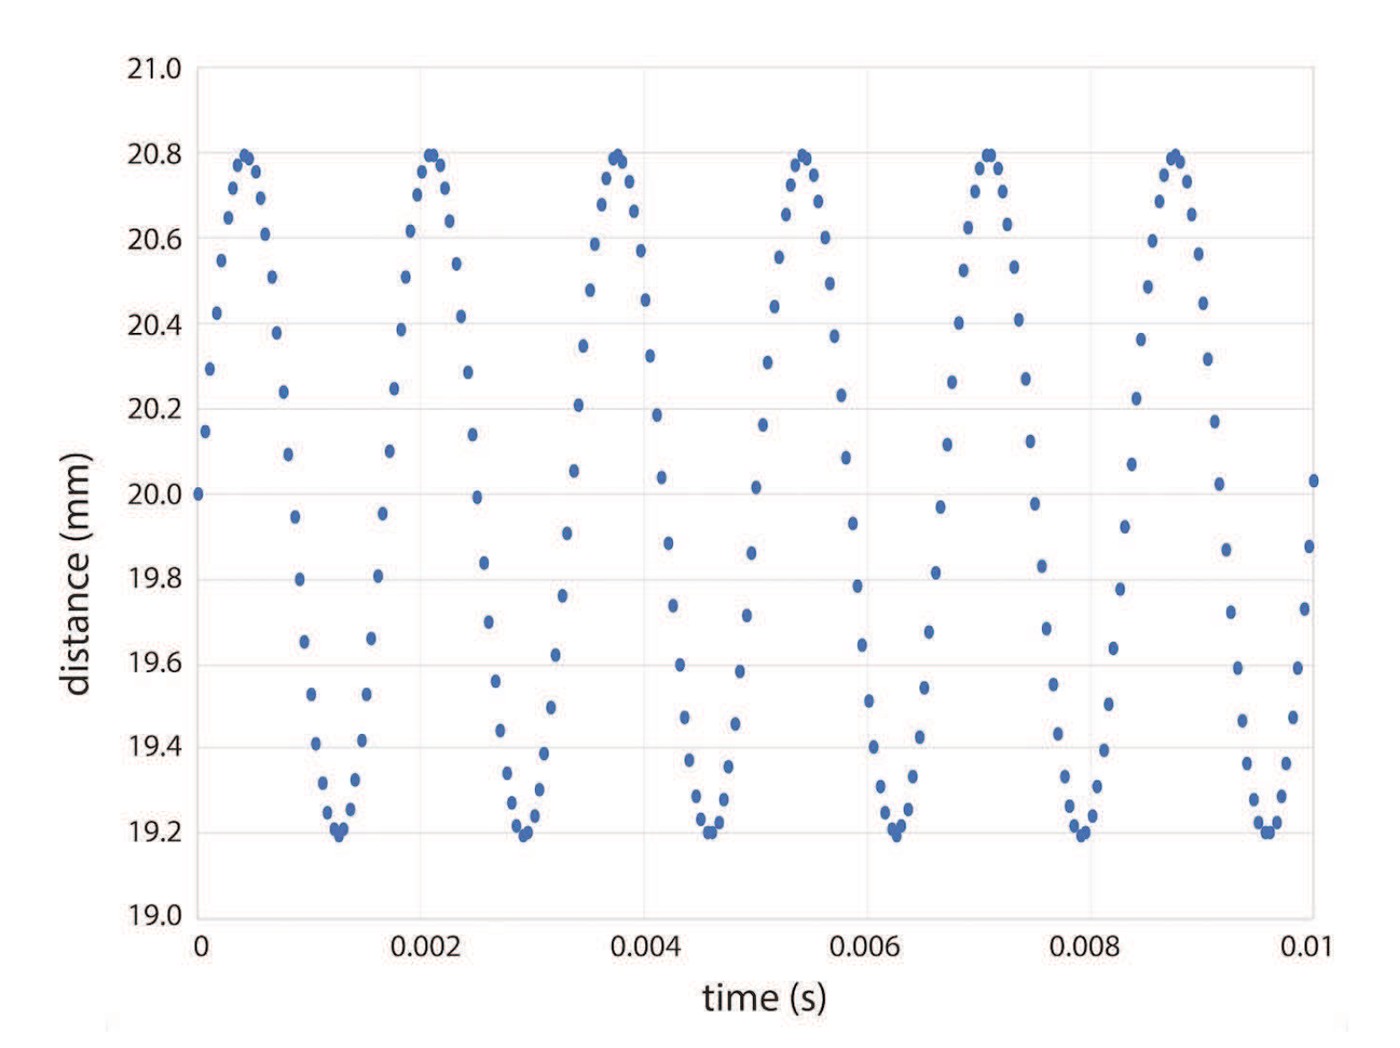
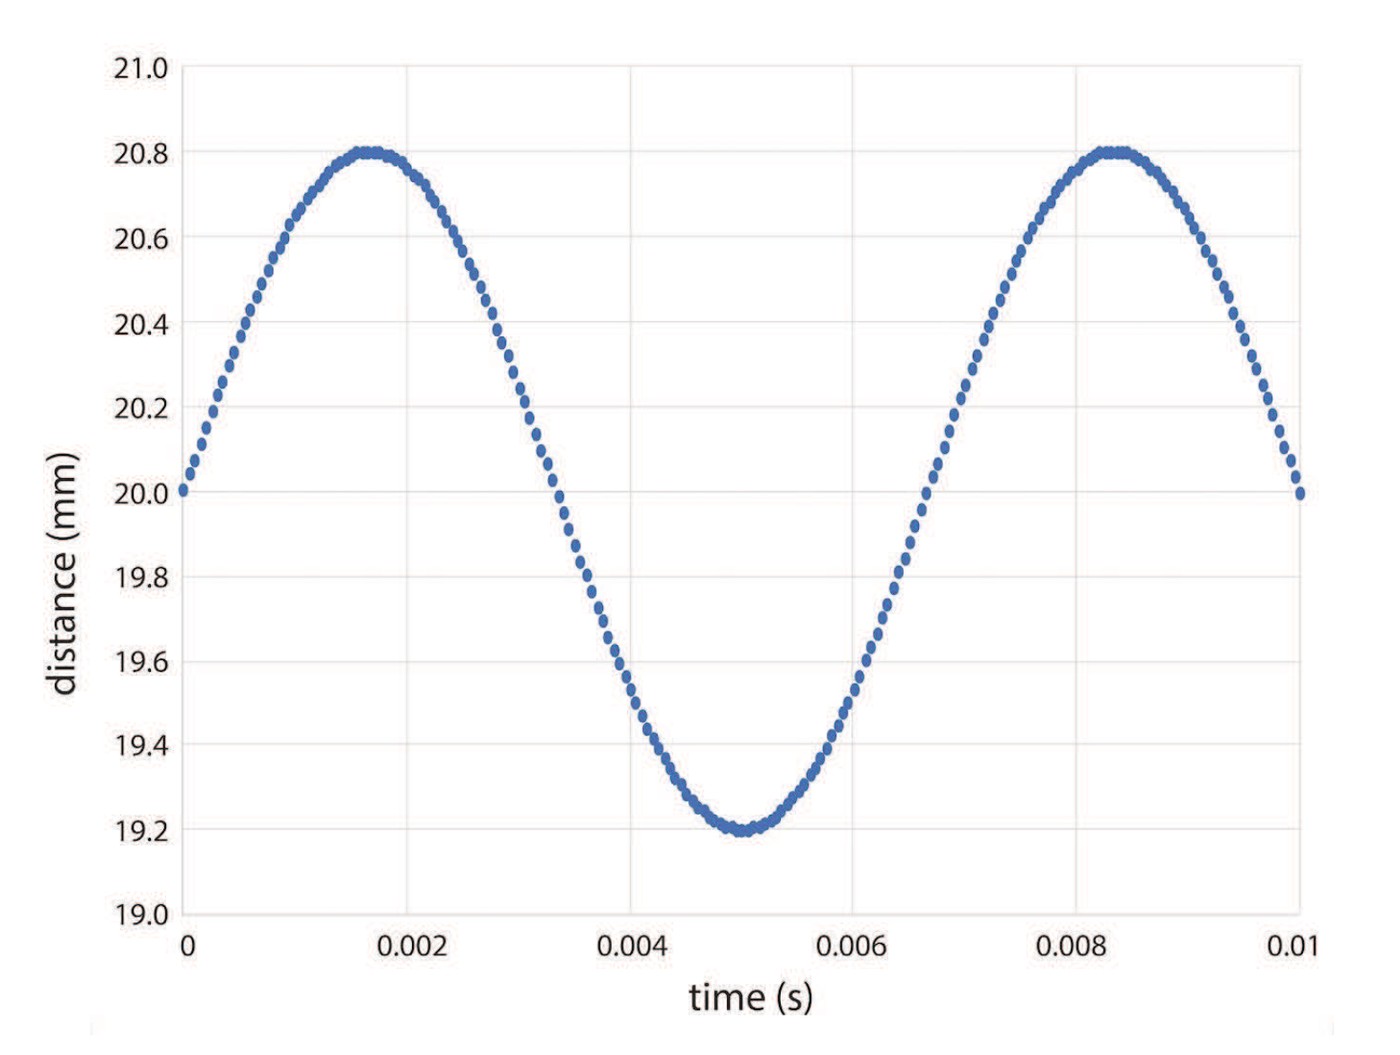
A supplied graph with six complete cycles in 0.02 s gives 300 Hz; four cycles in the same interval gives 200 Hz. Equal vertical height does not imply equal pitch. Read both axes before comparing graphs.
Pause and explain
Why is counting only crests without an interval insufficient?
Check your reasoning after answering
Frequency needs the number of complete cycles divided by a defined time. An unscaled drawing alone does not establish hertz.
Part 4 · Connect source, medium and receiver
The vibrating source exerts forces on adjacent matter. Successive interactions transfer the disturbance through the medium, and a receiver can vibrate in response. Air particles mainly oscillate locally rather than travel all the way from source to receiver. A hearing system receives mechanical input and converts it into signals to the brain.
Read the visual model
A medium is the material through which a mechanical wave travels. A receiver can be an ear, a window or a sensor. Describe what changes at each stage and distinguish matter movement from the disturbance’s travel.
What is wrong with saying a piece of the vibrating ruler travels through the air into the listener’s ear?
Visual reasoning — after your attempt
The ruler stays near its source position. A disturbance and energy pass through interactions in the medium; local particle motion does not require transport of ruler material to the receiver.
A simplified chain is ruler → nearby air → farther air → receiver. A paper membrane can be a model receiver, but detectable motion depends on many factors. Failure to see it move at quiet volume is not evidence that energy transfer never occurs.
Pause and explain
What is missing from a drawing with only a source and an ear?
Check your reasoning after answering
The intermediate medium and interactions, and how the receiver responds. The picture should also identify limits such as scale and omitted biological detail.
Apply the whole unit · Three source records
Illustrative case for analysis, not measurements collected by the learner. Illustrative sources A/B/C have amplitudes 1/3/1 mm and complete 4/4/6 cycles respectively in 0.02 s.
Your task
Compare frequency and amplitude and explain what a receiver prediction would need. Use the supplied conditions, show intermediate reasoning and distinguish the supported conclusion from a broader claim.
What your response should show
- Use the specified quantities and units.
- Explain an intermediate step or comparison.
- Connect the pattern to the physical mechanism.
- State an assumption or limitation.
Response guidance — after your attempt
Divide complete cycles by the common time window: A and B give 4/0.02=200 Hz.
C gives 6/0.02=300 Hz, so C has higher frequency while sharing A’s 1 mm amplitude.
Compare B/A amplitude: 3/1=3, without a changed frequency between those two sources.
For a receiver prediction, also specify distance, medium, losses and response; source amplitude does not fix exact perceived loudness.
A and B are 200 Hz, while C is 300 Hz. B has three times A’s amplitude; C has A’s amplitude but higher frequency. Frequency and amplitude are distinct. Predicting received sound also needs distance, medium, losses and receiver response. The source records alone do not establish an exact perceived loudness.
Scientific references and adapted teaching resources
- OpenSciEd 8.2 Sound Waves — public unit overview
- OpenSciEd 8.3 Forces at a Distance — public unit overview
- OpenSciEd instructional model — storyline routines
- Creative Commons Attribution 4.0 — middle-school material license
- OpenSciEd 8.2 Lesson 5 — Analyzing Graphs of Sound Source Vibrations (public handout)
Parent / teacher teaching notes
Ask the learner to describe the phenomenon before naming a formula. Discuss each checkpoint after an attempt. Use the supplied records when equipment is unavailable and label them illustrative rather than actual measurements. The final explanation should identify a mechanism and a limit, with different defensible wording accepted. Adaptation credit: OpenSciEd middle-school teaching routines and public task structures by OpenSciEd, CC BY 4.0. This independent version adds original explanatory text, data and figures, terminology support and a home-study schedule. It does not reproduce the complete teacher editions or their classroom validation.
The key idea
Amplitude and frequency can vary independently. Compare graph height and cycles per stated time separately. A and B are 200 Hz, while C is 300 Hz.
Worked examples
Example 1 · Build the first reasoning step
- Identify what the question asks and what the stated observation establishes.
- No. The motion can be too fast or small to detect with the chosen method. A suitable measurement or record is needed.
Example 2 · Three source records
- Divide complete cycles by the common time window: A and B give 4/0.02=200 Hz.
- C gives 6/0.02=300 Hz, so C has higher frequency while sharing A’s 1 mm amplitude.
- Compare B/A amplitude: 3/1=3, without a changed frequency between those two sources.
- For a receiver prediction, also specify distance, medium, losses and response; source amplitude does not fix exact perceived loudness.
Explain why each stated condition matters.
Example 3 · Transfer to a different condition
- Identify the changed condition.
- Pitch is associated with the shared frequency, while loudness may differ with amplitude under comparable source, medium, distance and receiver conditions. Neither quantity is a universal perception guarantee.
Example 4 · Find and fix the mistake
- Distinguish what is observed from what is inferred.
- Amplitude and frequency can vary independently. Compare graph height and cycles per stated time separately.
Compare the claim with the stated observations and model assumptions.
Example 5 · Interpret the visual model
- Identify the represented objects, axes, labeled quantities and stated conditions before choosing a rule.
- A cycle is one complete repeat, such as one peak to the next matching peak. A taller trace does not automatically have more cycles. Compare amplitude and frequency one at a time rather than using the word louder for both.
- Neither has a higher frequency in this matched window. Displacement amplitude differs; a numerical vertical position scale and units are needed to measure it.
Keep the model’s stated limits explicit: Both source-position records show two cycles during the same stated time window, with different displacement amplitudes. Amplitude is measured from the middle position to a peak, not from peak to trough. The sketches compare patterns qualitatively; an actual amplitude and frequency require numerical axis scales, as in the OpenSciEd graphs used below.
Avoid these mistakes
- Amplitude and frequency can vary independently. Compare graph height and cycles per stated time separately.
- Do not treat a schematic drawing as a scale measurement or a universal guarantee.
- Keep the stated comparison conditions and measurement boundary explicit.
- A correct numerical result needs units and an explanation of its meaning.
Check your understanding
Does no visible motion prove that a source is not vibrating?
Discuss the answer
No. The motion can be too fast or small to detect with the chosen method. A suitable measurement or record is needed.
What is B’s amplitude and what quantity remains unchanged?
Discuss the answer
Amplitude is 3 mm. The cycle count per time, and hence frequency of 200 Hz, is unchanged in this comparison.
Why is counting only crests without an interval insufficient?
Discuss the answer
Frequency needs the number of complete cycles divided by a defined time. An unscaled drawing alone does not establish hertz.
What is missing from a drawing with only a source and an ear?
Discuss the answer
The intermediate medium and interactions, and how the receiver responds. The picture should also identify limits such as scale and omitted biological detail.
Return to the phenomenon
Illustrative sources A/B/C have amplitudes 1/3/1 mm and complete 4/4/6 cycles respectively in 0.02 s. Compare frequency and amplitude and explain what a receiver prediction would need. Revise your first explanation using a named idea from the lesson. Mark the changed part and the evidence that supports it.
Compare explanations after your attempt
A and B are 200 Hz, while C is 300 Hz. B has three times A’s amplitude; C has A’s amplitude but higher frequency. Frequency and amplitude are distinct. Predicting received sound also needs distance, medium, losses and receiver response. The source records alone do not establish an exact perceived loudness.
What should we investigate next?
Which condition could be changed to test a remaining uncertainty in this explanation? State the predicted observation and what result would challenge your model.
Investigate, explain and revise
Use these tasks after the three teaching sessions as needed. Discuss an attempted explanation before opening response guidance; a matching sentence is less important than a supported mechanism.
Activity 1 · Explain the new evidence case
Use the visible scenario above, Parts 1–4 and your first notebook model. No outside reading or equipment is required.
Your task
Illustrative sources A/B/C have amplitudes 1/3/1 mm and complete 4/4/6 cycles respectively in 0.02 s. Compare frequency and amplitude and explain what a receiver prediction would need. Write 100–150 words or give a labeled drawing with an equivalent oral explanation.
Success criteria
- Use two relevant stated records or conditions.
- Explain the mechanism rather than only repeat a definition.
- Label observation and inference.
- Name a changed model feature or a remaining uncertainty.
Hint
Read the stated boundary and conditions before selecting a relationship. The unit’s worked examples show intermediate steps.
Response guidance — discuss after your attempt
A and B are 200 Hz, while C is 300 Hz. B has three times A’s amplitude; C has A’s amplitude but higher frequency. Frequency and amplitude are distinct. Predicting received sound also needs distance, medium, losses and receiver response. The source records alone do not establish an exact perceived loudness.
Activity 2 · Read and extend the figure
Study the new labeled figure and its caption, then compare it with the associated teaching part.
Your task
Which source has the highest modeled pitch and which the largest amplitude? Explain what each important label represents. Add one missing feature that would be needed for a different question, and explain why the original figure leaves it out.
Success criteria
- Answer the figure question with its stated labels.
- Connect the visual representation to the scientific idea.
- Identify a specific limitation from the caption.
- Propose a useful change without misrepresenting supplied evidence.
Hint
Each row spans the same 0.02-second time interval with a common displacement scale, centered on its own rest line. A and B have four cycles and therefore 200 Hz; C has six and therefore 300 Hz. B has larger amplitude than A without higher frequency. These are original illustrative traces, not copied measurements.
Response guidance — discuss after your attempt
C has the highest frequency, 300 Hz; B has the largest displacement amplitude, 3 mm. The two properties are independent in this comparison. Each row spans the same 0.02-second time interval with a common displacement scale, centered on its own rest line. A and B have four cycles and therefore 200 Hz; C has six and therefore 300 Hz. B has larger amplitude than A without higher frequency. These are original illustrative traces, not copied measurements.
Words to know
- vibration
- Repeated motion around a rest position.
- source
- Object initiating the sound disturbance.
- receiver
- Object or system responding to the arriving disturbance.
- amplitude
- Largest displacement from rest in the simple oscillation model.
- frequency
- Complete cycles per second, measured in hertz.
- model
- A representation that explains selected features and makes predictions; it leaves other details out.
- evidence
- Relevant observations or records used to support or challenge a claim.
- system boundary
- The chosen limit separating the objects being studied from their surroundings.
- assumption
- A condition taken as true for a model or calculation and needing to be checked against the case.
In the real world
Illustrative sources A/B/C have amplitudes 1/3/1 mm and complete 4/4/6 cycles respectively in 0.02 s.
Exit check
Which source has the highest modeled pitch and which the largest amplitude? Explain the relevant mechanism and one model limitation.
Check your explanation after answering
C has the highest frequency, 300 Hz; B has the largest displacement amplitude, 3 mm. The two properties are independent in this comparison. Each row spans the same 0.02-second time interval with a common displacement scale, centered on its own rest line. A and B have four cycles and therefore 200 Hz; C has six and therefore 300 Hz. B has larger amplitude than A without higher frequency. These are original illustrative traces, not copied measurements.
Explain your reasoning without notes. If a key idea is missing, revisit the lesson and try again.
Wave Properties
Learning goals
- I can identify the amplitude, wavelength, frequency, and period of a wave.
- I can calculate wave speed using v = f × λ.
Readings for this unit
Before this unit
Identify a repeating cycle, distance and time.
Use three teaching sessions of about 40–45 minutes: first observe the phenomenon, draft a model and study Parts 1–2; next explain Parts 3–4 with the figures and evidence; then work the application, examples, practice, model revision and exit check. Divide any difficult part into smaller steps and revisit after feedback. Investigations, review and quizzes have separate sessions. Study the four visual parts across the scheduled sessions, then use the illustrated worked case and independent transfer questions. Extend or revisit a session when the learner cannot explain the figure; completion time is a proposed allocation, not a mastery guarantee.
Start with something to explain
What would explain the observations in wave properties?
Illustrative evidence case. Illustrative waves in the same medium travel at 12 m/s. A has frequency 3 Hz and B 6 Hz. Their amplitudes are equal.
Notice and wonder
Can you count hertz from this snapshot alone? Write two observations from the supplied record without guessing their cause. Include a quantity and its unit when given. An observation is what was recorded; an inference is what you think explains it.
Write one question about why the pattern occurs and one question about a comparison that could distinguish competing explanations. A testable question identifies what could be observed or measured.
Your first model
Before reading the model answer, sketch the named objects or particles and label what you think changes. Find wavelengths, distinguish spatial from time graphs and identify a limit of an energy comparison based on amplitude alone. Keep this first version so you can compare it with your later explanation.
Build the language from the idea
- wave
- A traveling disturbance that transfers energy. In a simple mechanical wave, particles mainly move locally rather than travel the entire distance with the disturbance.
- amplitude
- Largest displacement from rest in a simple wave model. Greater amplitude can mean greater energy under comparable medium, frequency and wave conditions.
- wavelength (λ)
- The distance between two matching points on a wave, like crest to crest.
- frequency (f)
- The number of waves passing a point each second, measured in hertz (Hz).
- period (T)
- The time it takes for one full wave to pass, T = 1 ÷ f.
- model
- A representation that explains selected features and makes predictions; it leaves other details out.
- evidence
- Relevant observations or records used to support or challenge a claim.
- system boundary
- The chosen limit separating the objects being studied from their surroundings.
- assumption
- A condition taken as true for a model or calculation and needing to be checked against the case.
A wave is a traveling disturbance that carries energy from one place to another without carrying matter along with it. That last part surprises people, so picture a leaf floating on a pond: when ripples pass by, the leaf just bobs up and down in place — it doesn't get swept across the pond. The energy moves forward, but the water (and the leaf riding on it) mostly stays put. Ocean waves, sound, and light are all waves moving energy this way.
Every wave can be described by a handful of key measurements. Amplitude is the height of the wave measured from its rest position up to a crest (its peak). Amplitude matters because it's tied directly to energy: the taller the wave, the more energy it's carrying. A gentle ripple has a small amplitude and little energy, while a towering storm wave has a huge amplitude and enough energy to knock you off your feet.
Wavelength (λ) is the distance between two matching points on a wave — most easily measured from one crest to the next. Frequency (f) counts how many complete waves pass a fixed point each second, measured in hertz (Hz); a frequency of 5 Hz means five whole waves stream by every second. Closely related is the period (T), the time it takes for just one full wave to pass. Frequency and period are two sides of the same coin — if many waves pass each second, each one must take very little time — so they're linked by T = 1 ÷ f.
These properties tie together in one of the most useful formulas in the unit: wave speed = frequency × wavelength, written v = f × λ. It makes intuitive sense — if lots of waves pass each second (high frequency) and each wave is long (big wavelength), the wave must be racing along quickly. The handy thing is that if you know any two of the three quantities (speed, frequency, wavelength), you can always rearrange the formula to find the third.
Understanding these few properties unlocks a huge range of technology and nature. The pitch of a musical note, the color of light, the station your radio tunes into, and the power of an ocean swell all come down to a wave's amplitude, wavelength, and frequency. Engineers who design antennas, musical instruments, or medical ultrasound machines are really just carefully controlling these same wave properties.
Frequency counts cycles each second and is measured in hertz; period is time per cycle. For a wave traveling in a uniform medium, speed=frequency×wavelength. Changing frequency usually changes wavelength when the medium keeps wave speed approximately fixed.
A wave transfers energy and information without requiring the medium to travel from source to receiver. Water can bob locally as a wave travels across a pond. Distinguish particle motion from the direction of wave propagation.
Amplitude measures displacement from equilibrium, not wavelength. In otherwise similar waves, a larger amplitude generally indicates more energy, while frequency changes the cycle rate. Read the vertical and horizontal axes before interpreting a wave drawing.
Build your understanding
Where this fits
This unit helps answer the chapter question: How do waves and circuits transfer energy and information? Keep a notebook table with the question, evidence, explanation and one unresolved issue. Revise a previous model only when you can name the new evidence or idea that changes it.
Use three teaching sessions of about 40–45 minutes: first observe the phenomenon, draft a model and study Parts 1–2; next explain Parts 3–4 with the figures and evidence; then work the application, examples, practice, model revision and exit check. Divide any difficult part into smaller steps and revisit after feedback. Investigations, review and quizzes have separate sessions.
Part 1 · Separate the traveling disturbance from local motion
A wave can carry energy while the material particles move locally. In a transverse model, local motion is perpendicular to travel; in a longitudinal model it is parallel. Real surface-water motion is more complex than a simple up-down string model, so label the model’s limits.
Read the visual model
Follow one material marker rather than only a crest. A transverse rope wave has local motion perpendicular to travel. Sound uses a different local-motion direction, so do not assume every mechanical wave looks like a vertical rope curve.
What is wrong with tracing the red rope mark along the moving crest to the far right?
Visual reasoning — after your attempt
That would confuse the traveling pattern with the local motion of the material. The marked rope location oscillates locally rather than being carried across with the crest.
A point on a string moves up and down while a disturbance travels along it. The point does not ride from the source to the far end. Draw separate arrows for local displacement and wave-travel direction.
Pause and explain
Does a traveling pulse require every particle to travel with it?
Check your reasoning after answering
No. Particles can move locally while interactions pass the disturbance and energy along. The travel of the pattern differs from bulk transport of matter.
Part 2 · Measure wavelength and amplitude on a spatial graph
Wavelength is distance between matching points of a repeating wave, such as adjacent crests. Amplitude is maximum displacement from equilibrium. A spatial snapshot has position on its horizontal axis; a time record at one point uses time instead. These graphs cannot be interpreted with identical horizontal-axis rules.
Read the visual model
Why is crest-to-trough height not the amplitude?
Visual reasoning — after your attempt
Amplitude measures maximum displacement from equilibrium. For a symmetric wave the full crest-to-trough height is twice the amplitude.
If neighboring crests are 0.5 m apart, wavelength is 0.5 m. If a crest is 0.04 m above equilibrium, amplitude is 0.04 m; the crest-to-trough height would be twice that for a symmetric sinusoidal model.
Pause and explain
Why is crest-to-trough height not the amplitude?
Check your reasoning after answering
Amplitude measures maximum displacement from equilibrium. For a symmetric wave the full crest-to-trough height is twice the amplitude.
Part 3 · Link cycle rate and wave speed
Frequency counts cycles per second in hertz; period is seconds per cycle. For a repeating wave, speed=frequency×wavelength. Changing source frequency in the same nondispersive model medium changes wavelength rather than necessarily changing wave speed. State the medium and model assumptions.
Read the visual model
Spatial means position across a region; temporal means change with time. Read the horizontal axis before interpreting a wavy line. Two curves that look alike can describe different quantities if one uses distance and the other time.
For the same frequency but a measured wavelength 2 m, what speed follows? Does the result identify a universal wave speed?
Visual reasoning — after your attempt
8 m/s follows for that supplied wave. It does not establish a universal speed; the wave type, medium and conditions must be stated.
A 4 Hz wave with wavelength 0.5 m travels at 2 m/s. At the same speed, doubling frequency to 8 Hz reduces wavelength to 0.25 m. Do not assume every higher-frequency wave in every medium travels faster.
Pause and explain
What happens to wavelength when frequency doubles at fixed speed?
Check your reasoning after answering
Wavelength halves, because speed=f×wavelength must remain the same. This conclusion uses the fixed-speed assumption.
Part 4 · Compare energy under matched conditions
For otherwise comparable waves, greater amplitude generally means more transferred energy. The exact relationship depends on the wave type and medium. Frequency, amplitude, and wavelength are distinct quantities; a taller wave drawing does not necessarily mean more cycles per second. Use separate measurements.
Read the visual model
Relative units compare amounts to a chosen reference rather than supplying joules directly. Read what is held constant before using a curve to compare different sounds, media or durations.
If amplitude doubles from 1 to 2 in this matched model, how does represented energy change? Which conditions must stay matched?
Visual reasoning — after your attempt
Energy rises from 1 to 4 units, a factor of four. Wave type, medium, frequency and duration must remain comparable for this simplified relation.
Two string-wave records can have the same frequency but different amplitude. Count cycles during the same interval for frequency and measure displacement for amplitude. A sketch without scale cannot support a precise energy comparison.
Pause and explain
Can two waves have equal frequency but different amplitude?
Check your reasoning after answering
Yes. Cycle rate and maximum displacement describe different features. Their energy transfers may differ under otherwise comparable conditions.
Apply the whole unit · Read a wave record
Illustrative wave: a point completes 12 cycles in 3 s; adjacent crests in a spatial snapshot are 0.6 m apart; crest displacement from equilibrium is 0.05 m. Assume a repeating wave at constant speed.
Your task
Calculate frequency, period, and wave speed. Label wavelength and amplitude on a sketch, distinguish local motion from travel, and predict wavelength if frequency doubles at the same speed.
What your response should show
- Use the supplied observations and measurements accurately; include units where needed.
- Explain the science behind your answer, rather than giving only a number or label.
- Show a labeled model, calculation, or evidence comparison as requested.
- State an assumption or limitation and suggest a useful next measurement.
Response guidance — after your attempt
Frequency=12/3=4 Hz; period=1/4=0.25 s; speed=4×0.6=2.4 m/s. Amplitude is 0.05 m. At 8 Hz and the same speed, wavelength is 0.3 m. Draw local particle motion separately from the travel arrow. The prediction uses a fixed-speed repeating-wave model.
Scientific references and adapted teaching resources
- OpenSciEd 8.2 Sound Waves — public unit overview
- OpenSciEd 8.3 Forces at a Distance — public unit overview
- OpenSciEd instructional model — storyline routines
- Creative Commons Attribution 4.0 — middle-school material license
Parent / teacher teaching notes
This required waves unit follows the force and energy chapters. Have the learner name horizontal axes before reading a wave graph. Keep amplitude, cycle count, and crest spacing in separate columns. Adaptation credit: OpenSciEd middle-school teaching routines and public task structures by OpenSciEd, CC BY 4.0. This independent version adds original explanatory text, data and figures, terminology support and a home-study schedule. It does not reproduce the complete teacher editions or their classroom validation.
The key idea
Wave speed = frequency × wavelength (v = f × λ); amplitude relates to energy, and period is the inverse of frequency (T = 1/f).
Wave Speed
v = f × λ
f is frequency in hertz (Hz); λ is wavelength in meters (m); v is wave speed in m/s.
Period
T = 1 ÷ f
T is the period in seconds; f is frequency in Hz.
Worked examples
Example 1
- Use v = f × λ.
- v = 5 × 2.
- = 10.
Example 2 · Worked application
- Frequency=cycles/time=12/3=4 Hz.
- Use v=fλ.
- v=4×2=8 m/s.
Hz means cycles per second, not meters per second.
Example 3
- Rearrange v = f × λ to solve for frequency: f = v ÷ λ.
- f = 20 ÷ 4.
- = 5.
Example 4
- Frequency=v/λ=12/3=4 Hz.
- Period=1/f=1/4=0.25 s.
Example 5 · Find and fix the mistake
- Test the claim against the stated conditions: Hz means cycles per second, not meters per second.
- Amplitude and frequency describe different properties. Changing height does not alone determine how often cycles pass.
Hz means cycles per second, not meters per second.
Example 6 · Interpret the visual model
- Identify the represented objects, axes, labeled quantities and stated conditions before choosing a rule.
- Follow one material marker rather than only a crest. A transverse rope wave has local motion perpendicular to travel. Sound uses a different local-motion direction, so do not assume every mechanical wave looks like a vertical rope curve.
- That would confuse the traveling pattern with the local motion of the material. The marked rope location oscillates locally rather than being carried across with the crest.
Keep the model’s stated limits explicit: The three conceptual rope snapshots show a pattern shifting along the rope while a marked location retains its horizontal coordinate and changes vertical position. The rope wave carries a disturbance and energy; a piece of rope does not need to move from source to receiver. These qualitative snapshots omit time scales and are not a calibrated wave-speed measurement.
Avoid these mistakes
- Particles of a medium need not travel with the wave from source to receiver.
Check your understanding
A wave travels at 12 m/s with wavelength 3 m. Find frequency and period.
Discuss the answer
4 Hz and 0.25 s per cycle.
How do wavelength and amplitude appear differently on a wave diagram?
Discuss the answer
Frequency counts cycles each second and is measured in hertz; period is time per cycle. For a wave traveling in a uniform medium, speed=frequency×wavelength. Changing frequency usually changes wavelength when the medium keeps wave speed approximately fixed. A wave transfers energy and information without requiring the medium to travel from source to receiver. Water can bob locally as a wave travels across a pond. Distinguish particle motion from the direction of wave propagation.
Return to the phenomenon
Illustrative waves in the same medium travel at 12 m/s. A has frequency 3 Hz and B 6 Hz. Their amplitudes are equal. Find wavelengths, distinguish spatial from time graphs and identify a limit of an energy comparison based on amplitude alone. Revise your first explanation using a named idea from the lesson. Mark the changed part and the evidence that supports it.
Compare explanations after your attempt
Using wavelength=speed/frequency, A is 4 m and B 2 m. A displacement–distance graph shows wavelength; a displacement–time graph shows period and frequency at a location. Equal amplitude does not generally establish equal energy for different frequencies or wave conditions; specify the medium, frequency and model for energy comparisons.
What should we investigate next?
Which condition could be changed to test a remaining uncertainty in this explanation? State the predicted observation and what result would challenge your model.
Investigate, explain and revise
Use these tasks after the three teaching sessions as needed. Discuss an attempted explanation before opening response guidance; a matching sentence is less important than a supported mechanism.
Activity 1 · Explain the new evidence case
Use the visible scenario above, Parts 1–4 and your first notebook model. No outside reading or equipment is required.
Your task
Illustrative waves in the same medium travel at 12 m/s. A has frequency 3 Hz and B 6 Hz. Their amplitudes are equal. Find wavelengths, distinguish spatial from time graphs and identify a limit of an energy comparison based on amplitude alone. Write 100–150 words or give a labeled drawing with an equivalent oral explanation.
Success criteria
- Use two relevant stated records or conditions.
- Explain the mechanism rather than only repeat a definition.
- Label observation and inference.
- Name a changed model feature or a remaining uncertainty.
Hint
Read the stated boundary and conditions before selecting a relationship. The unit’s worked examples show intermediate steps.
Response guidance — discuss after your attempt
Using wavelength=speed/frequency, A is 4 m and B 2 m. A displacement–distance graph shows wavelength; a displacement–time graph shows period and frequency at a location. Equal amplitude does not generally establish equal energy for different frequencies or wave conditions; specify the medium, frequency and model for energy comparisons.
Activity 2 · Read and extend the figure
Study the new labeled figure and its caption, then compare it with the associated teaching part.
Your task
Can you count hertz from this snapshot alone? Explain what each important label represents. Add one missing feature that would be needed for a different question, and explain why the original figure leaves it out.
Success criteria
- Answer the figure question with its stated labels.
- Connect the visual representation to the scientific idea.
- Identify a specific limitation from the caption.
- Propose a useful change without misrepresenting supplied evidence.
Hint
This displacement-versus-position snapshot labels amplitude from rest and wavelength between matching crests. It does not show frequency without time information, and it is not a drawing of a sound particle’s entire travel path. Units are identified; the sketch does not assign numerical tick values.
Response guidance — discuss after your attempt
No. Frequency requires cycles per time, not merely the number of crests in a spatial drawing. This displacement-versus-position snapshot labels amplitude from rest and wavelength between matching crests. It does not show frequency without time information, and it is not a drawing of a sound particle’s entire travel path. Units are identified; the sketch does not assign numerical tick values.
Words to know
- wave
- A traveling disturbance that transfers energy. In a simple mechanical wave, particles mainly move locally rather than travel the entire distance with the disturbance.
- amplitude
- Largest displacement from rest in a simple wave model. Greater amplitude can mean greater energy under comparable medium, frequency and wave conditions.
- wavelength (λ)
- The distance between two matching points on a wave, like crest to crest.
- frequency (f)
- The number of waves passing a point each second, measured in hertz (Hz).
- period (T)
- The time it takes for one full wave to pass, T = 1 ÷ f.
- model
- A representation that explains selected features and makes predictions; it leaves other details out.
- evidence
- Relevant observations or records used to support or challenge a claim.
- system boundary
- The chosen limit separating the objects being studied from their surroundings.
- assumption
- A condition taken as true for a model or calculation and needing to be checked against the case.
Waves move energy, not matter — proof from a floating duck
Watch a duck floating on a pond as a wave passes underneath: the duck bobs up and down in place, but it doesn't get swept along with the wave toward shore. That's because a wave transfers energy through a medium without permanently transporting the medium's matter along with it — each water particle mostly moves in a small circle and returns close to where it started. It's the same idea behind 'the wave' at a stadium: no single fan actually travels around the stadium, they just stand and sit in place while the pattern of motion races past them.
Why doubling amplitude actually quadruples the energy
The main lesson says bigger amplitude means more energy, but the actual relationship is sharper than that: a wave's energy is proportional to its amplitude squared, not just its amplitude. Double a wave's amplitude, and it carries four times the energy — the exact same doubling-squares-to-quadrupling pattern you'll see with kinetic energy (KE = ½mv²) in the Energy unit. This is why a tsunami, with an amplitude many times larger than a normal ocean wave, carries a wildly disproportionate amount of destructive energy, not just a 'somewhat bigger' amount.
P waves and S waves: how scientists locate an earthquake's epicenter
Earthquakes send out two main types of seismic waves that travel at different speeds: fast P waves (primary waves, which squeeze and stretch the ground like a longitudinal wave) and slower S waves (secondary waves, which shake the ground side to side like a transverse wave). Seismologists measure the time gap between a P wave and S wave arriving at a monitoring station — the bigger the gap, the farther away the earthquake happened — and combine readings from three or more stations to pinpoint the exact epicenter, the same way you might triangulate a sound's source.
Christiaan Huygens, Isaac Newton, and 300 years of arguing about waves
In the 1670s, Dutch scientist Christiaan Huygens proposed that light travels as a wave, while Isaac Newton favored the idea that light was made of tiny particles ('corpuscles'). Newton's enormous scientific reputation kept the particle theory dominant for over a century, until Thomas Young's 1801 double-slit experiment showed light behaving unmistakably like a wave, creating interference patterns that only waves produce. The debate wasn't fully resolved even then — twentieth-century physics eventually revealed that light behaves as both a wave and a particle, depending on how you look for it.
In the real world
Radio stations broadcast at specific frequencies, and knowing wave speed helps engineers design antennas of the right size to receive them.
Exit check
Can you count hertz from this snapshot alone? Explain the relevant mechanism and one model limitation.
Check your explanation after answering
No. Frequency requires cycles per time, not merely the number of crests in a spatial drawing. This displacement-versus-position snapshot labels amplitude from rest and wavelength between matching crests. It does not show frequency without time information, and it is not a drawing of a sound particle’s entire travel path. Units are identified; the sketch does not assign numerical tick values.
Explain your reasoning without notes. If a key idea is missing, revisit the lesson and try again.
Sound Waves
Learning goals
- I can describe sound as a longitudinal (compression) wave that needs a medium to travel.
- I can relate pitch to frequency and loudness to amplitude.
Readings for this unit
Before this unit
Know that gases contain particles and waves can be longitudinal.
Use three teaching sessions of about 40–45 minutes: first observe the phenomenon, draft a model and study Parts 1–2; next explain Parts 3–4 with the figures and evidence; then work the application, examples, practice, model revision and exit check. Divide any difficult part into smaller steps and revisit after feedback. Investigations, review and quizzes have separate sessions. Study the four visual parts across the scheduled sessions, then use the illustrated worked case and independent transfer questions. Extend or revisit a session when the learner cannot explain the figure; completion time is a proposed allocation, not a mastery guarantee.
Start with something to explain
What would explain the observations in sound waves?
Illustrative evidence case. An illustrative echo returns 0.30 s after a short sound. The modeled sound speed is 340 m/s, and the path goes from source to wall and back.
Notice and wonder
Do these dots need to travel from speaker to ear? Write two observations from the supplied record without guessing their cause. Include a quantity and its unit when given. An observation is what was recorded; an inference is what you think explains it.
Write one question about why the pattern occurs and one question about a comparison that could distinguish competing explanations. A testable question identifies what could be observed or measured.
Your first model
Before reading the model answer, sketch the named objects or particles and label what you think changes. Find one-way distance and explain the medium’s role. Distinguish particle motion from the travelling disturbance. Keep this first version so you can compare it with your later explanation.
Build the language from the idea
- longitudinal wave
- A wave where particles vibrate back and forth in the SAME direction the wave travels.
- compression
- A region of a longitudinal wave where particles are squeezed close together.
- rarefaction
- A region of a longitudinal wave where particles are spread farther apart.
- pitch
- How high or low a sound seems, determined by its frequency.
- medium
- The matter (solid, liquid, or gas) that a wave travels through.
- model
- A representation that explains selected features and makes predictions; it leaves other details out.
- evidence
- Relevant observations or records used to support or challenge a claim.
- system boundary
- The chosen limit separating the objects being studied from their surroundings.
- assumption
- A condition taken as true for a model or calculation and needing to be checked against the case.
Sound is a longitudinal wave, and that word describes how it moves. Unlike the up-and-down ripples on water, the particles carrying a sound wave vibrate back and forth in the very same direction the wave is traveling. As they do, they create a repeating pattern of two regions: compressions, where the particles are momentarily squeezed close together, and rarefactions, where they're stretched farther apart. A sound wave is really this pattern of squeeze-and-stretch rippling outward from its source.
Ordinary sound needs a material medium such as air, water, or a solid. Local particle interactions pass pressure or elastic disturbances along, so sound does not propagate through a vacuum. Speed depends on the medium’s elastic properties and density, as well as conditions such as temperature. Many solids transmit sound faster than air, but particles being closer together is not a sufficient explanation by itself. Use the speed supplied for the specific medium when calculating distance.
Frequency largely determines a tone’s perceived pitch. Amplitude and intensity relate to loudness under comparable conditions, while frequency, distance, and individual hearing also affect perception. A higher-frequency tone is not necessarily louder, and a louder tone does not necessarily have higher frequency. Compare one feature at a time with supplied records. Quiet observations are sufficient; learners do not need loud sound exposure to study these relationships.
Sound travels at a steady but fairly leisurely pace — about 343 m/s in room-temperature air. That's quick by everyday standards, but far, far slower than light. This speed gap is exactly why you see a distant lightning flash almost instantly but hear its thunder seconds later: the light reaches you nearly at once, while the sound has to plod across all those kilometers. You can even estimate the distance using distance = speed × time — roughly every three seconds of delay means the storm is about a kilometer away.
Grasping how sound waves work explains a surprising amount of daily life — why a thick wall muffles noise (it's a poor medium for passing the vibration through cleanly), why your voice sounds different underwater, and why a tuning fork or a plucked guitar string produces one clear pitch. It's also the foundation of technologies like ultrasound scans, the sonar that maps the ocean floor, and the microphones and speakers that turn vibrating air into signals and back again.
Sound in air consists of pressure variations with compressions and rarefactions. Air particles move back and forth locally while the disturbance travels. Sound needs a material medium, so ordinary sound does not cross a vacuum.
Frequency largely determines pitch, and amplitude relates to loudness under comparable conditions. Sound speed depends on the medium and temperature. A higher-pitched sound in the same air does not simply travel faster because it has a higher frequency.
An echo involves a round trip from source to reflector and back. Multiply travel time by speed to find total path length, then divide by two for the distance to the reflector. Protect hearing: experiments do not require loud sounds or listening close to speakers.
Build your understanding
Where this fits
This unit helps answer the chapter question: How do waves and circuits transfer energy and information? Keep a notebook table with the question, evidence, explanation and one unresolved issue. Revise a previous model only when you can name the new evidence or idea that changes it.
Use three teaching sessions of about 40–45 minutes: first observe the phenomenon, draft a model and study Parts 1–2; next explain Parts 3–4 with the figures and evidence; then work the application, examples, practice, model revision and exit check. Divide any difficult part into smaller steps and revisit after feedback. Investigations, review and quizzes have separate sessions.
Part 1 · Model sound as pressure variations
Sound in air consists of pressure variations that pass through a material medium. Air particles move back and forth locally, creating compressions and rarefactions while the disturbance travels. An ordinary sound wave does not cross a vacuum because no medium particles are present to support that process.
Read the visual model
What travels from a speaker to the listener in this model?
Visual reasoning — after your attempt
The pressure disturbance and energy travel through the air. Individual particles move locally rather than carrying themselves from speaker to listener.
Draw a line of particles with alternating close and less-close spacing. Show travel and local motion along the same axis in the longitudinal model. Do not show one particle traveling all the way from a speaker to a listener.
Pause and explain
What travels from a speaker to the listener in this model?
Check your reasoning after answering
The pressure disturbance and energy travel through the air. Individual particles move locally rather than carrying themselves from speaker to listener.
Part 2 · Distinguish pitch from loudness
Frequency largely determines perceived pitch. Amplitude and intensity relate to perceived loudness under comparable conditions, but distance, hearing, and frequency also affect perception. A louder tone need not have higher frequency, and a high-pitched tone is not necessarily louder. Protect hearing when discussing measurements.
Read the visual model
What changes if a tone’s amplitude increases while frequency stays fixed?
Visual reasoning — after your attempt
Under comparable conditions its intensity and perceived loudness generally increase, while its basic pitch remains linked to the unchanged frequency.
Compare two supplied records with equal cycle rate but different pressure amplitudes. They can have the same basic pitch and different loudness at the same listener position. The example does not require playing loud tones.
Read A/B/C in the figure as a separate supplied example: divide 2 or 4 cycles by 0.01 s for 200 or 400 Hz. A/B changes frequency while amplitude stays at one relative unit; A/C changes amplitude while frequency stays at 200 Hz. The graph is pressure variation at a location versus time, not the path of a moving air particle. Loudness remains a perception influenced by more than one condition.
Pause and explain
What changes if a tone’s amplitude increases while frequency stays fixed?
Check your reasoning after answering
Under comparable conditions its intensity and perceived loudness generally increase, while its basic pitch remains linked to the unchanged frequency.
Part 3 · State the conditions for sound speed
Sound speed depends on properties such as elasticity, density, and temperature of the medium. A dense material is not automatically a faster medium; stiffness also matters. Many solids carry sound faster than air, but particle closeness alone is an incomplete explanation. Use the supplied speed for a calculation.
Read the visual model
Why should a sound-speed value include a medium or condition?
Visual reasoning — after your attempt
Speed depends on the medium’s properties and temperature. One number is not a universal value for all gases, liquids, solids, or temperatures.
For introductory air calculations near room temperature, a supplied value around 340 m/s may be used. Higher pitch in the same ordinary air does not simply make sound travel faster. Temperature changes can alter the appropriate speed.
For the figure’s supplied models, a one-second disturbance travels 340, 1,500 or 5,000 m respectively. Those labels identify three different medium examples, not three pitches in the same air. Real composition and conditions change the appropriate value, so a medium label and assumptions belong beside the speed.
Pause and explain
Why should a sound-speed value include a medium or condition?
Check your reasoning after answering
Speed depends on the medium’s properties and temperature. One number is not a universal value for all gases, liquids, solids, or temperatures.
Part 4 · Use the full path for echoes
An echo time covers travel to a reflecting surface and back. Multiply speed by total time to find round-trip path length, then divide by two for one-way distance when source and receiver are at the same location. A one-way delay needs a different interpretation.
Read the visual model
When should you divide speed×time by two?
Visual reasoning — after your attempt
When the measured time includes a round trip from the colocated source/receiver to a reflector and back, under the stated path and speed assumptions.
At 340 m/s, an echo after 0.5 s traveled 170 m total, so the reflector is 85 m away in the simple straight-path model. State the round-trip assumption before dividing by two.
Use the figure’s 0.40-second record as another worked case. The clock runs during both arrows, giving 136 m total and 68 m one way. Mark the measured time interval on your drawing before deciding whether to halve the calculated path. A thunder delay describes sound arriving after a light flash and is an approximately one-way case, so it is not treated like an echo.
Pause and explain
When should you divide speed×time by two?
Check your reasoning after answering
When the measured time includes a round trip from the colocated source/receiver to a reflector and back, under the stated path and speed assumptions.
Apply the whole unit · Interpret an echo and two tones
Illustrative record: an echo returns after 0.40 s; use sound speed 340 m/s. Tone A is 250 Hz and tone B 500 Hz, with otherwise comparable measurement conditions.
Your task
Calculate reflector distance, sketch the round-trip path, and compare basic pitch. Explain why frequency alone cannot establish which tone is louder or which arrives faster in the same ordinary air.
What your response should show
- Use the supplied observations and measurements accurately; include units where needed.
- Explain the science behind your answer, rather than giving only a number or label.
- Show a labeled model, calculation, or evidence comparison as requested.
- State an assumption or limitation and suggest a useful next measurement.
Response guidance — after your attempt
Round-trip path=340×0.40=136 m, so reflector distance is 68 m. B has higher basic pitch because its frequency is higher. Loudness needs amplitude/intensity and listening conditions; frequency alone is insufficient. Under the stated ordinary-air approximation both have essentially the supplied speed. The distance calculation assumes a direct out-and-back path.
Scientific references and adapted teaching resources
- OpenSciEd 8.2 Sound Waves — public unit overview
- OpenSciEd 8.3 Forces at a Distance — public unit overview
- OpenSciEd instructional model — storyline routines
- Creative Commons Attribution 4.0 — middle-school material license
Parent / teacher teaching notes
Use a path drawing before division. Keep tests quiet and optional; supplied data are sufficient. Replace explanations based only on particles being closer with medium properties and stated conditions. Adaptation credit: OpenSciEd middle-school teaching routines and public task structures by OpenSciEd, CC BY 4.0. This independent version adds original explanatory text, data and figures, terminology support and a home-study schedule. It does not reproduce the complete teacher editions or their classroom validation.
The key idea
Sound is a longitudinal wave of compressions and rarefactions that needs a medium; frequency controls pitch, and amplitude controls loudness.
Distance from Speed and Time
d = v × t
v is the speed of sound (about 343 m/s in air); t is time in seconds; d is distance in meters.
Worked examples
Example 1
- Use distance = speed × time.
- d = 343 × 6.
- = 2,058.
Example 2 · Worked application
- Sound travels to the wall and back.
- Round-trip distance=340×0.4=136 m.
- One-way distance=136/2=68 m.
Remember the return path; the echo delay is not one-way time.
Example 3
- Rearrange v = f × λ to solve for wavelength: λ = v ÷ f.
- λ = 343 ÷ 686.
- = 0.5.
Example 4
- Total path=340×0.4=136 m.
- The path goes to the wall and back, so wall distance=136/2=68 m.
Example 5 · Find and fix the mistake
- Test the claim against the stated conditions: Remember the return path; the echo delay is not one-way time.
- Loudness relates to amplitude and perception; pitch relates primarily to frequency. They can vary independently.
Remember the return path; the echo delay is not one-way time.
Example 6 · Interpret the visual model
- Identify the represented objects, axes, labeled quantities and stated conditions before choosing a rule.
- Draw a line of particles with alternating close and less-close spacing. Show travel and local motion along the same axis in the longitudinal model. Do not show one particle traveling all the way from a speaker to a listener.
- The pressure disturbance and energy travel through the air. Individual particles move locally rather than carrying themselves from speaker to listener.
Keep the model’s stated limits explicit: A sound wave is a pattern of crowding and spreading passing through matter. Drawing it as particles rather than as a curve makes the requirement obvious: remove the particles and there is nothing left to carry the pattern.
Avoid these mistakes
- An echo's travel time includes the outward and return paths.
Check your understanding
An echo returns after 0.4 s. Using sound speed 340 m/s, find the distance to the reflecting wall.
Discuss the answer
68 m to the wall in this model.
Why does sound need a medium while light can cross space?
Discuss the answer
Sound in air consists of pressure variations with compressions and rarefactions. Air particles move back and forth locally while the disturbance travels. Sound needs a material medium, so ordinary sound does not cross a vacuum. Frequency largely determines pitch, and amplitude relates to loudness under comparable conditions. Sound speed depends on the medium and temperature. A higher-pitched sound in the same air does not simply travel faster because it has a higher frequency.
Return to the phenomenon
An illustrative echo returns 0.30 s after a short sound. The modeled sound speed is 340 m/s, and the path goes from source to wall and back. Find one-way distance and explain the medium’s role. Distinguish particle motion from the travelling disturbance. Revise your first explanation using a named idea from the lesson. Mark the changed part and the evidence that supports it.
Compare explanations after your attempt
The round-trip path is 340×0.30=102 m, so one-way distance is 51 m. Ordinary sound needs matter, with successive compressions and expansions transmitting a disturbance. Individual air particles mainly oscillate near their positions rather than travel the complete path. The arithmetic assumes the stated speed and clear timing.
What should we investigate next?
Which condition could be changed to test a remaining uncertainty in this explanation? State the predicted observation and what result would challenge your model.
Investigate, explain and revise
Use these tasks after the three teaching sessions as needed. Discuss an attempted explanation before opening response guidance; a matching sentence is less important than a supported mechanism.
Activity 1 · Explain the new evidence case
Use the visible scenario above, Parts 1–4 and your first notebook model. No outside reading or equipment is required.
Your task
An illustrative echo returns 0.30 s after a short sound. The modeled sound speed is 340 m/s, and the path goes from source to wall and back. Find one-way distance and explain the medium’s role. Distinguish particle motion from the travelling disturbance. Write 100–150 words or give a labeled drawing with an equivalent oral explanation.
Success criteria
- Use two relevant stated records or conditions.
- Explain the mechanism rather than only repeat a definition.
- Label observation and inference.
- Name a changed model feature or a remaining uncertainty.
Hint
Read the stated boundary and conditions before selecting a relationship. The unit’s worked examples show intermediate steps.
Response guidance — discuss after your attempt
The round-trip path is 340×0.30=102 m, so one-way distance is 51 m. Ordinary sound needs matter, with successive compressions and expansions transmitting a disturbance. Individual air particles mainly oscillate near their positions rather than travel the complete path. The arithmetic assumes the stated speed and clear timing.
Activity 2 · Read and extend the figure
Study the new labeled figure and its caption, then compare it with the associated teaching part.
Your task
Do these dots need to travel from speaker to ear? Explain what each important label represents. Add one missing feature that would be needed for a different question, and explain why the original figure leaves it out.
Success criteria
- Answer the figure question with its stated labels.
- Connect the visual representation to the scientific idea.
- Identify a specific limitation from the caption.
- Propose a useful change without misrepresenting supplied evidence.
Hint
The dots model local particle crowding rather than literal air colors. Compressions and rarefactions form a traveling disturbance while particles mainly oscillate locally. The two arrow types distinguish disturbance propagation from local motion; the schematic omits particle-scale distances and random thermal motion.
Response guidance — discuss after your attempt
No. Successive interactions can transfer the disturbance while the particles mainly move near their local positions. The dots model local particle crowding rather than literal air colors. Compressions and rarefactions form a traveling disturbance while particles mainly oscillate locally. The two arrow types distinguish disturbance propagation from local motion; the schematic omits particle-scale distances and random thermal motion.
Words to know
- longitudinal wave
- A wave where particles vibrate back and forth in the SAME direction the wave travels.
- compression
- A region of a longitudinal wave where particles are squeezed close together.
- rarefaction
- A region of a longitudinal wave where particles are spread farther apart.
- pitch
- How high or low a sound seems, determined by its frequency.
- medium
- The matter (solid, liquid, or gas) that a wave travels through.
- model
- A representation that explains selected features and makes predictions; it leaves other details out.
- evidence
- Relevant observations or records used to support or challenge a claim.
- system boundary
- The chosen limit separating the objects being studied from their surroundings.
- assumption
- A condition taken as true for a model or calculation and needing to be checked against the case.
Sound travels faster through solids and liquids than through air
Sound needs particles bumping into their neighbors to travel, so the more tightly packed those particles are, the faster a sound wave can move through them. Sound travels through air at about 343 m/s, but through water at about 1,480 m/s — over four times faster — and through solid steel at roughly 5,960 m/s, more than seventeen times faster than air. That's why old Western movies show characters pressing an ear to a train track: solid metal rails carry the sound of an approaching train far faster (and farther) than the air ever could.
The Doppler effect: why a siren's pitch drops as it passes you
In 1842, Austrian physicist Christian Doppler proposed that a moving sound source should seem to shift pitch for a listener — sound waves bunch closer together in front of a source moving toward you (raising the frequency and pitch you hear) and stretch farther apart behind it (lowering the pitch). Three years later, Dutch scientist Buys Ballot tested the idea in a memorable experiment: trumpet players performed a single sustained note aboard a moving train, while musicians with sharp pitch memory listened from the platform and confirmed the pitch really did shift exactly as Doppler predicted. You hear this exact effect every time an ambulance siren passes you on the street.
Decibels: measuring loudness on a logarithmic scale
Like the pH scale, the decibel (dB) scale used for loudness is logarithmic, not a simple straight-line ruler: every increase of 10 dB means the sound's intensity is 10 times greater, not just '10 units louder.' A whisper measures around 30 dB, normal conversation around 60 dB, and a loud rock concert around 110 dB — meaning that concert isn't just 'somewhat louder' than a conversation, its sound intensity is roughly 100,000 times greater (a 50 dB gap = 10⁵). That's exactly why sustained exposure to loud concerts and headphones can damage hearing so much faster than people expect.
Echolocation: seeing with sound
Bats and dolphins navigate and hunt using echolocation: they emit rapid ultrasonic pulses — sound waves with frequencies above 20,000 Hz, higher than human ears can detect — and listen for the returning echoes to build a detailed picture of their surroundings, including the size, shape, distance, and even texture of nearby objects and prey. Humans borrowed the same trick technologically: sonar lets ships and submarines 'see' underwater using sound pulses, and medical ultrasound imaging uses the same principle of interpreting echoes to safely picture a developing fetus or internal organs without any radiation.
In the real world
Counting the seconds between seeing lightning and hearing thunder lets you estimate how far away a storm is.
Exit check
Do these dots need to travel from speaker to ear? Explain the relevant mechanism and one model limitation.
Check your explanation after answering
No. Successive interactions can transfer the disturbance while the particles mainly move near their local positions. The dots model local particle crowding rather than literal air colors. Compressions and rarefactions form a traveling disturbance while particles mainly oscillate locally. The two arrow types distinguish disturbance propagation from local motion; the schematic omits particle-scale distances and random thermal motion.
Explain your reasoning without notes. If a key idea is missing, revisit the lesson and try again.
Light & the Electromagnetic Spectrum
Learning goals
- I can order the electromagnetic spectrum by wavelength, frequency, and energy.
- I can describe how light interacts with materials through reflection, absorption, and transmission.
Readings for this unit
Before this unit
Place wavelength and frequency in inverse order for fixed speed.
Use three teaching sessions of about 40–45 minutes: first observe the phenomenon, draft a model and study Parts 1–2; next explain Parts 3–4 with the figures and evidence; then work the application, examples, practice, model revision and exit check. Divide any difficult part into smaller steps and revisit after feedback. Investigations, review and quizzes have separate sessions. Study the four visual parts across the scheduled sessions, then use the illustrated worked case and independent transfer questions. Extend or revisit a session when the learner cannot explain the figure; completion time is a proposed allocation, not a mastery guarantee.
Start with something to explain
What would explain the observations in light & the electromagnetic spectrum?
Illustrative evidence case. Illustrative light energy incident on a sheet is 100 units: 25 reflected, 60 transmitted and 15 absorbed. A ray drawing shows only a transmitted arrow.
Notice and wonder
Why is a transmitted arrow alone incomplete here? Write two observations from the supplied record without guessing their cause. Include a quantity and its unit when given. An observation is what was recorded; an inference is what you think explains it.
Write one question about why the pattern occurs and one question about a comparison that could distinguish competing explanations. A testable question identifies what could be observed or measured.
Your first model
Before reading the model answer, sketch the named objects or particles and label what you think changes. Complete the diagram and energy account, then explain why light crossing a vacuum differs from ordinary sound. Keep this first version so you can compare it with your later explanation.
Build the language from the idea
- electromagnetic (EM) wave
- A wave that can travel through empty space, carrying energy as vibrating electric and magnetic fields.
- electromagnetic spectrum
- The full range of EM waves, ordered from long, low-energy radio waves to short, high-energy gamma rays.
- reflection
- Light bouncing off a surface instead of passing through it.
- absorption
- Light energy being taken in by a material, often becoming thermal energy.
- transmission
- Light passing through a material, like light through clear glass.
- model
- A representation that explains selected features and makes predictions; it leaves other details out.
- evidence
- Relevant observations or records used to support or challenge a claim.
- system boundary
- The chosen limit separating the objects being studied from their surroundings.
- assumption
- A condition taken as true for a model or calculation and needing to be checked against the case.
Light is an electromagnetic (EM) wave — a ripple of vibrating electric and magnetic fields. Unlike sound, it needs no medium whatsoever, which is how sunlight crosses the empty vacuum of space to reach us. Light is also staggeringly fast, traveling at about 300,000,000 m/s (3 × 10⁸ m/s) — quick enough to circle the entire Earth roughly seven times in a single second. Nothing in the universe travels faster.
Visible light is only a tiny slice of a much larger family. The electromagnetic spectrum is the full range of EM waves, arranged by wavelength. Starting from the longest waves and working down, it runs: radio waves, microwaves, infrared, then the narrow band of visible light our eyes can detect, followed by ultraviolet, X-rays, and finally gamma rays with the shortest wavelengths. They're all fundamentally the same kind of wave — they differ only in wavelength.
In a vacuum, shorter wavelength corresponds to higher frequency and higher energy per photon, while wave speed remains the same. Total delivered energy also depends on intensity and duration. Ionizing radiation can damage matter, but lower photon energy does not make every possible exposure harmless; interaction, power, and duration matter. The spectrum is an organizing model, not a complete safety chart. Use ordinary safe illumination or supplied data, without direct Sun viewing or laser experiments.
When light strikes an object, three things can happen to it. It can be reflected — bounced back, the way a mirror throws your image back at you. It can be absorbed — soaked in and usually turned into thermal energy, which is why a black shirt gets hot in the sun. Or it can be transmitted — passed straight through, the way sunlight streams through clear glass. Most objects do a mix of all three, and an object's color is simply the wavelengths of light it reflects instead of absorbing: a red apple absorbs most colors but bounces red light back to your eyes.
Because each part of the spectrum carries a different amount of energy and interacts with matter differently, we've found a use for nearly all of it. Doctors use high-energy X-rays to photograph bones and gamma rays to destroy tumors; we cook with microwaves, feel warmth as infrared, communicate through radio waves, and see the world by visible light. Reading the electromagnetic spectrum is really a guide to how energy travels and how it touches everything around you.
Electromagnetic waves include radio, microwave, infrared, visible, ultraviolet, X-ray and gamma-ray regions. They travel at the same speed in a vacuum. Shorter wavelength corresponds to higher frequency and higher photon energy, not a faster vacuum speed.
Reflection sends light back into the original medium. Refraction changes direction when light enters a medium where its speed differs, except along the normal. Absorption transfers energy to matter. Several processes can happen at one surface, such as a window partly reflecting and transmitting.
An object looks colored because of the light it sends to the eye under the illumination provided. A red object may look dark under light with little red content. A diagram showing rays helps trace paths, but does not show all wave behavior; choose the model for the question.
Build your understanding
Where this fits
This unit helps answer the chapter question: How do waves and circuits transfer energy and information? Keep a notebook table with the question, evidence, explanation and one unresolved issue. Revise a previous model only when you can name the new evidence or idea that changes it.
Use three teaching sessions of about 40–45 minutes: first observe the phenomenon, draft a model and study Parts 1–2; next explain Parts 3–4 with the figures and evidence; then work the application, examples, practice, model revision and exit check. Divide any difficult part into smaller steps and revisit after feedback. Investigations, review and quizzes have separate sessions.
Part 1 · Recognize one electromagnetic family
Radio, microwave, infrared, visible, ultraviolet, X-ray, and gamma-ray regions belong to the electromagnetic spectrum. In a vacuum they travel at the same speed, about 3×10⁸ m/s. They differ in frequency and wavelength; electromagnetic waves do not require a material medium as sound does.
Read the visual model
Does a gamma ray move faster than a radio wave in a vacuum?
Visual reasoning — after your attempt
No. Both travel at the same vacuum light speed. Their frequencies, wavelengths, and photon energies differ.
A radio signal and visible light can both cross space. Their different frequencies do not give different vacuum speeds. In matter, propagation and interactions depend on the material, so the vacuum-speed rule needs its stated condition.
Pause and explain
Does a gamma ray move faster than a radio wave in a vacuum?
Check your reasoning after answering
No. Both travel at the same vacuum light speed. Their frequencies, wavelengths, and photon energies differ.
Part 2 · Keep photon energy separate from total exposure
Higher frequency corresponds to higher energy per photon. Total transferred energy also depends on how much radiation arrives and for how long. Lower photon energy does not automatically mean every exposure is harmless; intensity and how radiation interacts with tissue or material matter.
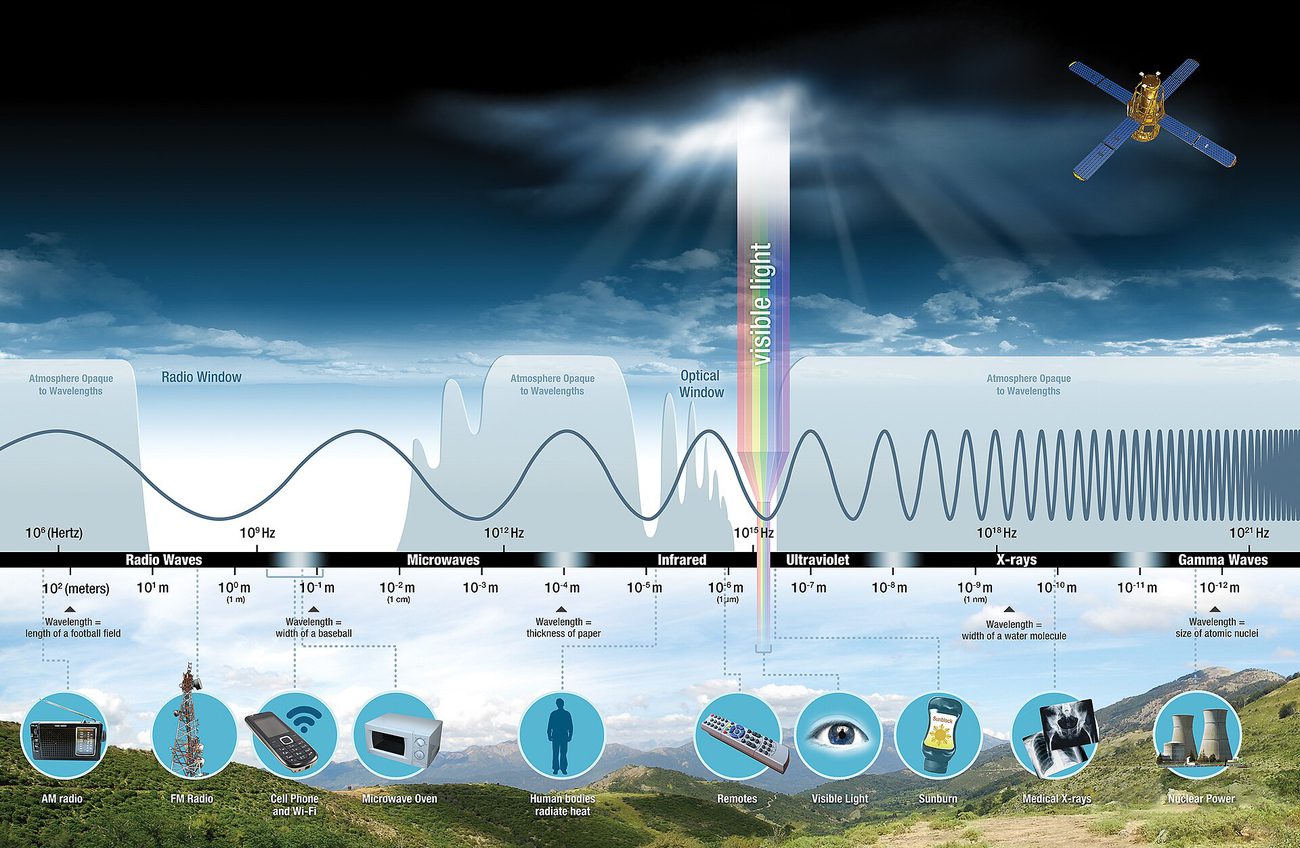
Read the visual model
A photon is a quantum of electromagnetic radiation. Per-photon energy, arrival amount and exposure duration are distinct. Do not replace a total-energy comparison with a frequency-only slogan when the photon counts or duration also change.
Which case has more energy per photon, and which has more total supplied energy for the matched comparison?
Visual reasoning — after your attempt
The higher-frequency case has more per photon (2 versus 1). The lower-frequency case has more total (8 versus 6), because it has more supplied photons.
A weak visible beam and a high-power visible beam can have similar photon frequency but very different total energy delivery. Do not use spectrum position alone as a complete safety rule. Avoid lasers and direct Sun viewing in home activities.
Pause and explain
Why is frequency alone insufficient to judge total delivered energy?
Check your reasoning after answering
Frequency sets energy per photon, while photon quantity, intensity, and exposure duration affect total delivery. Interaction with material also matters.
Part 3 · Trace reflection, absorption, and transmission
At a surface, light may be reflected, absorbed, or transmitted. Refraction describes a direction change as light passes between media with different propagation properties, except for suitable normal incidence. Several processes can occur at once, as a window can both reflect and transmit light.
Read the visual model
Keep pathways distinct from the material’s microscopic structure. OpenSciEd’s coating diagrams below help explain why changing a surface can change the proportions. An incoming-ray picture alone is not a completed outgoing-light or energy account.
If a second material reflects 15 and transmits 65 of the same 100 units, what is the absorbed amount in the full stated account?
Visual reasoning — after your attempt
20 units: 100−15−65. That result requires the account to include all relevant outgoing and retained changes, rather than silently ignoring another pathway.
Draw an incoming ray and label which portion returns, passes through, or transfers energy to the material. A dark surface may absorb much of a given visible illumination, but actual behavior depends on wavelength and material.
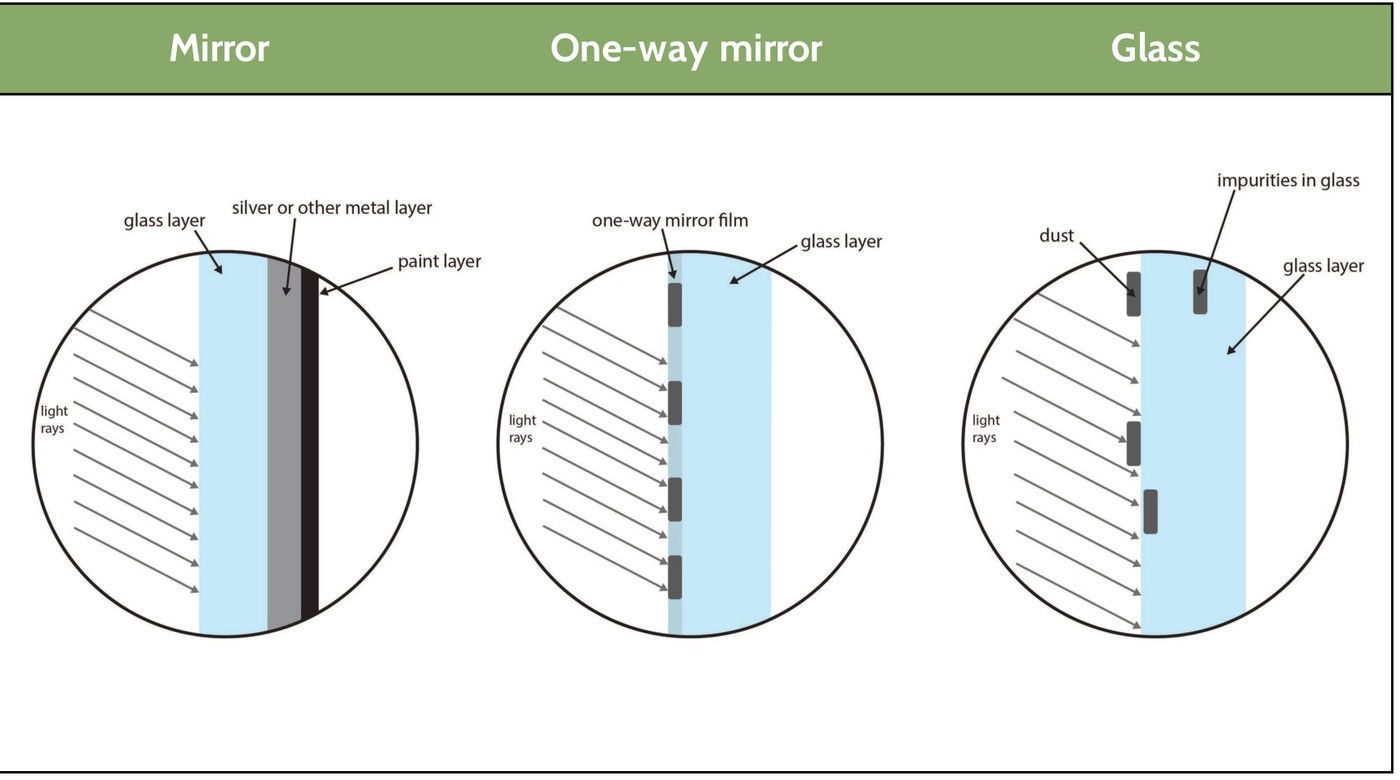
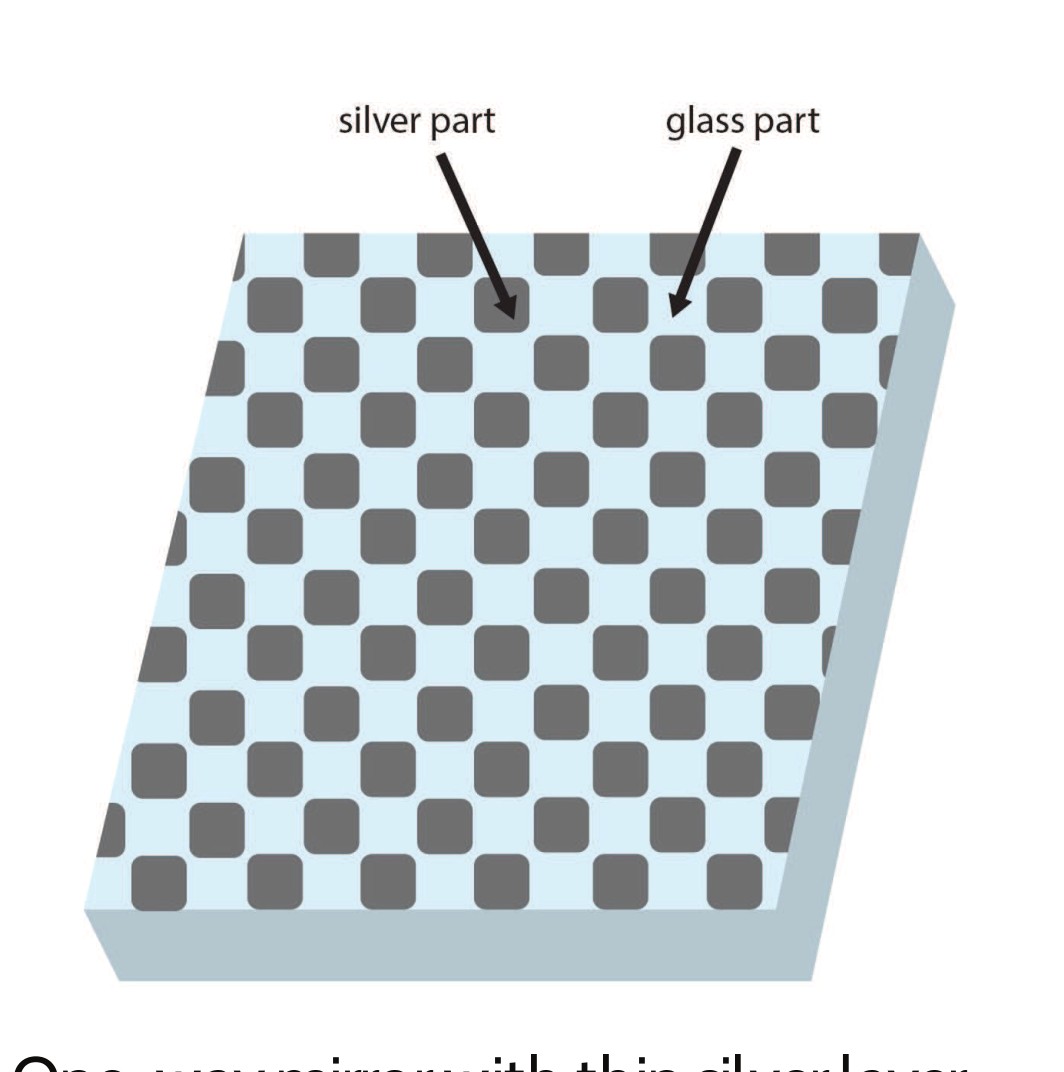
Pause and explain
Can a transparent window also reflect light?
Check your reasoning after answering
Yes. Some incident light can be transmitted while some is reflected or absorbed. Transparent does not mean perfect transmission at every wavelength.
Part 4 · Explain color using source and object together
An opaque object sends selected wavelengths of incident light toward the eye. Its apparent color depends on the illumination and its reflection properties. A red surface under a source with little red light can appear dark. A ray model helps trace paths but does not represent every wave phenomenon.
Read the visual model
Reflection carries some incoming light toward an observer. Absorption transfers energy to the material. The blue absorption arrow is a pathway label, not a claim that blue photons travel out of the object after being absorbed.
Does an object called red have to look red under every lamp? Use the model to explain a different result.
Visual reasoning — after your attempt
No. Its appearance depends on the wavelengths arriving as well as those reflected toward an observer. With blue-only illumination it may reflect little and appear dark.
Compare a supplied red-object record under white light and nearly blue-only light. The object has not necessarily changed composition; the available illuminating wavelengths changed. Keep source color and reflected light separate in the drawing.
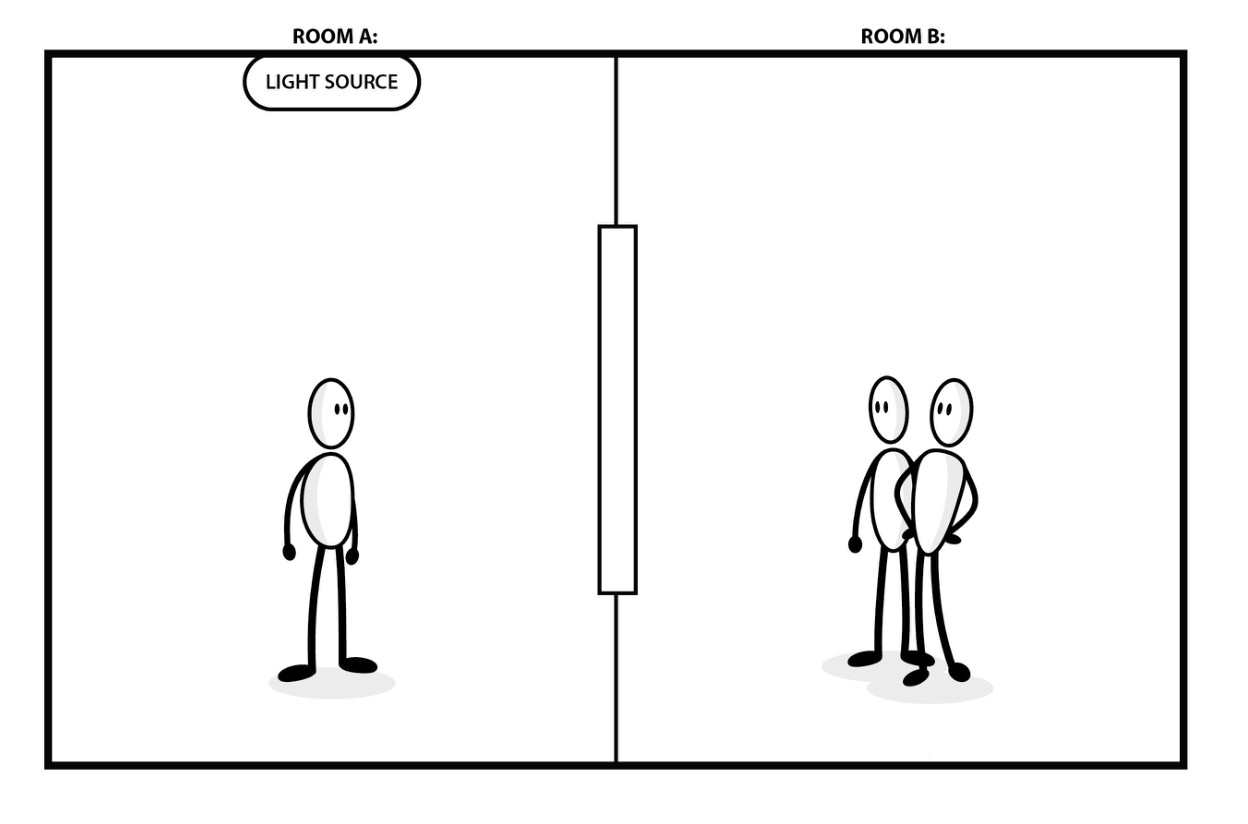
Pause and explain
Why might a red object look dark under nearly blue-only light?
Check your reasoning after answering
There is little red light available to reflect, and the object absorbs much of the incident blue light. Appearance depends on both source spectrum and surface properties.
Apply the whole unit · Explain a window and a colored object
Illustrative record: a window receives 100 J of a stated radiation band, transmits 80 J, and reflects 15 J. A red surface looks red under white light but dark under nearly blue-only illumination.
Your task
Complete the window energy account under the stated no-storage-change assumption. Draw the light paths, explain the color change, and state why these observations do not establish behavior for every wavelength or radiation exposure.
What your response should show
- Use the supplied observations and measurements accurately; include units where needed.
- Explain the science behind your answer, rather than giving only a number or label.
- Show a labeled model, calculation, or evidence comparison as requested.
- State an assumption or limitation and suggest a useful next measurement.
Response guidance — after your attempt
The remaining 5 J is absorbed if those are the only transfers and storage changes are neglected. Label transmitted, reflected, and absorbed portions. The red surface receives little red illumination in the second case, so less red light reaches the eye. A band-specific record does not establish all-spectrum transparency or exposure safety; material response and intensity vary.
Scientific references and adapted teaching resources
- OpenSciEd 8.2 Sound Waves — public unit overview
- OpenSciEd 8.3 Forces at a Distance — public unit overview
- OpenSciEd instructional model — storyline routines
- Creative Commons Attribution 4.0 — middle-school material license
Parent / teacher teaching notes
This required waves unit is included in the final exam. Use supplied data and ordinary safe illumination. Check the distinction between wavelength, vacuum speed, photon energy, and total exposure; never use direct Sun viewing or laser experiments. Adaptation credit: OpenSciEd middle-school teaching routines and public task structures by OpenSciEd, CC BY 4.0. This independent version adds original explanatory text, data and figures, terminology support and a home-study schedule. It does not reproduce the complete teacher editions or their classroom validation.
The key idea
The EM spectrum ranges from long, low-energy radio waves to short, high-energy gamma rays; light hitting matter is reflected, absorbed, or transmitted.
Speed of Light Wave Equation
c = f × λ
c is the speed of light (about 3 × 10⁸ m/s); f is frequency in Hz; λ is wavelength in meters.
Worked examples
Example 1
- Recall the spectrum order: radio waves have the longest wavelengths, then microwaves, infrared, visible light, ultraviolet, X-rays, and gamma rays have the shortest.
- Pick out just the four listed waves in that order.
Example 2 · Worked application
- Both are electromagnetic waves and have the same vacuum speed c.
- Visible light has higher frequency than typical radio waves.
- At fixed speed, λ=c/f means higher frequency corresponds to shorter wavelength.
Compare speed in the same medium; do not confuse frequency with speed.
Example 3
- Use λ = v ÷ f.
- λ = 300,000,000 ÷ 1,000,000.
- = 300.
Example 4
- White light contains red wavelengths that the material can reflect toward the eye.
- Blue illumination provides little red light to reflect and much may be absorbed.
Example 5 · Find and fix the mistake
- Test the claim against the stated conditions: Compare speed in the same medium; do not confuse frequency with speed.
- All electromagnetic waves have the same vacuum speed. Frequency changes wavelength and photon energy, not vacuum speed.
Compare speed in the same medium; do not confuse frequency with speed.
Example 6 · Interpret the visual model
- Identify the represented objects, axes, labeled quantities and stated conditions before choosing a rule.
- A photon is a quantum of electromagnetic radiation. Per-photon energy, arrival amount and exposure duration are distinct. Do not replace a total-energy comparison with a frequency-only slogan when the photon counts or duration also change.
- The higher-frequency case has more per photon (2 versus 1). The lower-frequency case has more total (8 versus 6), because it has more supplied photons.
Keep the model’s stated limits explicit: The deliberately simplified lower-frequency case has eight photons at one relative energy unit each; the higher-frequency case has three at two units each. Totals are eight and six under the matched area/time comparison. The circles are a counting aid rather than literal photon shapes. Higher frequency means higher energy per photon, but total exposure also depends on how many arrive and the comparison conditions.
Avoid these mistakes
- All electromagnetic waves have the same vacuum speed even though their frequencies differ.
Check your understanding
A red shirt appears bright under white light but dark under blue light. Explain without changing the shirt's material.
Discuss the answer
The reflected light depends on both the material and the illumination.
Why does a higher-frequency electromagnetic wave not have a higher vacuum speed?
Discuss the answer
Electromagnetic waves include radio, microwave, infrared, visible, ultraviolet, X-ray and gamma-ray regions. They travel at the same speed in a vacuum. Shorter wavelength corresponds to higher frequency and higher photon energy, not a faster vacuum speed. Reflection sends light back into the original medium. Refraction changes direction when light enters a medium where its speed differs, except along the normal. Absorption transfers energy to matter. Several processes can happen at one surface, such as a window partly reflecting and transmitting.
Return to the phenomenon
Illustrative light energy incident on a sheet is 100 units: 25 reflected, 60 transmitted and 15 absorbed. A ray drawing shows only a transmitted arrow. Complete the diagram and energy account, then explain why light crossing a vacuum differs from ordinary sound. Revise your first explanation using a named idea from the lesson. Mark the changed part and the evidence that supports it.
Compare explanations after your attempt
The three pathways sum to 100 units; add reflected and absorbed arrows with their quantities. Absorbed energy can contribute to thermal changes. Light is an electromagnetic disturbance and can cross a vacuum, while ordinary sound requires material interactions. A ray model shows paths and energy partitions but not every wave or microscopic effect.
What should we investigate next?
Which condition could be changed to test a remaining uncertainty in this explanation? State the predicted observation and what result would challenge your model.
Investigate, explain and revise
Use these tasks after the three teaching sessions as needed. Discuss an attempted explanation before opening response guidance; a matching sentence is less important than a supported mechanism.
Activity 1 · Explain the new evidence case
Use the visible scenario above, Parts 1–4 and your first notebook model. No outside reading or equipment is required.
Your task
Illustrative light energy incident on a sheet is 100 units: 25 reflected, 60 transmitted and 15 absorbed. A ray drawing shows only a transmitted arrow. Complete the diagram and energy account, then explain why light crossing a vacuum differs from ordinary sound. Write 100–150 words or give a labeled drawing with an equivalent oral explanation.
Success criteria
- Use two relevant stated records or conditions.
- Explain the mechanism rather than only repeat a definition.
- Label observation and inference.
- Name a changed model feature or a remaining uncertainty.
Hint
Read the stated boundary and conditions before selecting a relationship. The unit’s worked examples show intermediate steps.
Response guidance — discuss after your attempt
The three pathways sum to 100 units; add reflected and absorbed arrows with their quantities. Absorbed energy can contribute to thermal changes. Light is an electromagnetic disturbance and can cross a vacuum, while ordinary sound requires material interactions. A ray model shows paths and energy partitions but not every wave or microscopic effect.
Activity 2 · Read and extend the figure
Study the new labeled figure and its caption, then compare it with the associated teaching part.
Your task
Why is a transmitted arrow alone incomplete here? Explain what each important label represents. Add one missing feature that would be needed for a different question, and explain why the original figure leaves it out.
Success criteria
- Answer the figure question with its stated labels.
- Connect the visual representation to the scientific idea.
- Identify a specific limitation from the caption.
- Propose a useful change without misrepresenting supplied evidence.
Hint
The supplied model partitions 100 light-energy units among reflection, transmission and absorption. Arrow widths and angles are schematic and do not establish a ray-angle calculation. Absorption can contribute to thermal changes, while a complete wave model would add properties not shown in this ray account.
Response guidance — discuss after your attempt
It omits the reflected 25 and absorbed 15 units, preventing a complete energy account. The supplied model partitions 100 light-energy units among reflection, transmission and absorption. Arrow widths and angles are schematic and do not establish a ray-angle calculation. Absorption can contribute to thermal changes, while a complete wave model would add properties not shown in this ray account.
Words to know
- electromagnetic (EM) wave
- A wave that can travel through empty space, carrying energy as vibrating electric and magnetic fields.
- electromagnetic spectrum
- The full range of EM waves, ordered from long, low-energy radio waves to short, high-energy gamma rays.
- reflection
- Light bouncing off a surface instead of passing through it.
- absorption
- Light energy being taken in by a material, often becoming thermal energy.
- transmission
- Light passing through a material, like light through clear glass.
- model
- A representation that explains selected features and makes predictions; it leaves other details out.
- evidence
- Relevant observations or records used to support or challenge a claim.
- system boundary
- The chosen limit separating the objects being studied from their surroundings.
- assumption
- A condition taken as true for a model or calculation and needing to be checked against the case.
Is light a wave or a particle? Yes.
The old Huygens-vs-Newton argument over whether light is a wave or a stream of particles didn't end with Young's 1801 wave experiment. In 1905, Albert Einstein explained a puzzling phenomenon called the photoelectric effect — where light striking a metal knocks electrons loose — by proposing that light also arrives in discrete packets of energy called photons, behaving like particles after all. This explanation, and not his more famous work on relativity, is what won Einstein his Nobel Prize. Modern physics accepts that light — and every wave in the electromagnetic spectrum — genuinely behaves as both a wave and a stream of particles, a strange but experimentally rock-solid idea called wave-particle duality.
Wilhelm Röntgen's accidental discovery that could see through skin
In 1895, German physicist Wilhelm Röntgen was experimenting with a device that made a nearby screen glow, even with opaque material blocking the direct path — evidence of a mysterious, invisible new kind of ray. He called it an X-ray, using 'X' for 'unknown,' and famously produced the first-ever X-ray image: a picture of his wife's hand, showing her bones and wedding ring in ghostly detail. The medical world was transformed almost overnight, and Röntgen won the very first Nobel Prize in Physics in 1901 for the discovery.
One family, wildly different energies
Radio waves, visible light, and gamma rays sound like completely different things, but they're literally the exact same phenomenon — oscillating electric and magnetic fields — differing only in wavelength and frequency. Higher frequency waves carry more energy packed into each photon, which is exactly why gamma rays and X-rays can damage living cells and DNA (they carry enough energy per photon to break chemical bonds), while radio waves constantly passing harmlessly through your body from every nearby radio station carry far too little energy per photon to do any damage at all.
Invisible light shapes our planet: greenhouse gases and the ozone layer
Two wavelengths you can't see have planet-sized effects. Infrared radiation from the Sun warms Earth's surface, and gases like carbon dioxide absorb and re-emit some of that infrared back downward instead of letting it escape to space — the greenhouse effect that keeps Earth's average temperature livable (and, in excess, drives climate change). Meanwhile, high-energy ultraviolet radiation from the Sun is mostly absorbed by the ozone layer high in the atmosphere before it can reach the ground and damage the DNA of living things. Both are everyday reminders that the electromagnetic spectrum extends far beyond what your eyes can detect.
In the real world
Doctors use high-energy X-rays to see inside the body, while remote controls use lower-energy infrared waves to send signals to your TV.
Exit check
Why is a transmitted arrow alone incomplete here? Explain the relevant mechanism and one model limitation.
Check your explanation after answering
It omits the reflected 25 and absorbed 15 units, preventing a complete energy account. The supplied model partitions 100 light-energy units among reflection, transmission and absorption. Arrow widths and angles are schematic and do not establish a ray-angle calculation. Absorption can contribute to thermal changes, while a complete wave model would add properties not shown in this ray account.
Explain your reasoning without notes. If a key idea is missing, revisit the lesson and try again.
Waves, Information & a Speaker System
Learning goals
- I can trace the linked electrical, magnetic, mechanical and sound mechanisms in a speaker.
- I can decode a supplied threshold signal and explain noise limits and different vacuum-transfer cases.
Readings for this unit
Before this unit
Review the earlier circuits, magnetic forces and sound-wave units. The visible language notes explain this unit’s quantities; then connect them to its concrete records and figure.
Use three teaching sessions of about 40–45 minutes: first observe the phenomenon, draft a model and study Parts 1–2; next explain Parts 3–4 with the figures and evidence; then work the application, examples, practice, model revision and exit check. Divide any difficult part into smaller steps and revisit after feedback. Investigations, review and quizzes have separate sessions. Study the four visual parts across the scheduled sessions, then use the illustrated worked case and independent transfer questions. Extend or revisit a session when the learner cannot explain the figure; completion time is a proposed allocation, not a mastery guarantee.
Start with something to explain
What would explain the observations in waves, information & a speaker system?
Illustrative evidence case. Illustrative received values are 0.15, 0.85, 0.48 and 0.88 with threshold 0.5. A drawing shows electrical input jumping directly to an ear with no speaker or air.
Notice and wonder
What fails if the ordinary sound path becomes a vacuum gap? Write two observations from the supplied record without guessing their cause. Include a quantity and its unit when given. An observation is what was recorded; an inference is what you think explains it.
Write one question about why the pattern occurs and one question about a comparison that could distinguish competing explanations. A testable question identifies what could be observed or measured.
Your first model
Before reading the model answer, sketch the named objects or particles and label what you think changes. Decode the values, identify the less robust reading and revise the drawing with intermediate interactions. Keep this first version so you can compare it with your later explanation.
Build the language from the idea
- signal
- Changing physical pattern used to carry information.
- membrane
- Thin surface capable of moving or vibrating.
- analog
- Continuously varying representation.
- digital
- Representation using discrete permitted symbols.
- threshold
- Decision boundary for assigning a measurement to a category or symbol.
- model
- A representation that explains selected features and makes predictions; it leaves other details out.
- evidence
- Relevant observations or records used to support or challenge a claim.
- system boundary
- The chosen limit separating the objects being studied from their surroundings.
- assumption
- A condition taken as true for a model or calculation and needing to be checked against the case.
A signal is a changing physical pattern used to carry information. A message is its interpreted meaning.
In a speaker system, changing electrical current helps produce a changing magnetic interaction, which makes a membrane vibrate. A membrane is a thin movable surface.
Its motion disturbs nearby air, and sound travels to a receiver. The pieces connect earlier ideas about circuits, magnetic forces, motion and waves.
No speaker disassembly, loud sound or wall-powered experiment is required: use the supplied system model and data. The model explains a common moving-coil speaker; not every device has exactly this construction.
An observation is what a person or instrument records. An inference is a proposed interpretation of those records. Keep the two separate: a graph can show a pattern while more than one mechanism might explain it. State the chosen system, or part of the world being studied, and its boundary before accounting for material or energy transfers.
Use each figure as a reasoning tool. Read its caption and labels, describe the pattern, then explain a cause. If the picture is schematic, use the stated numbers rather than measuring its printed size. Check whether its simplified conditions match the problem before applying a formula.
Build your understanding
Where this fits
This unit helps answer the chapter question: How do waves and circuits transfer energy and information? Keep a notebook table with the question, evidence, explanation and one unresolved issue. Revise a previous model only when you can name the new evidence or idea that changes it.
Use three teaching sessions of about 40–45 minutes: first observe the phenomenon, draft a model and study Parts 1–2; next explain Parts 3–4 with the figures and evidence; then work the application, examples, practice, model revision and exit check. Divide any difficult part into smaller steps and revisit after feedback. Investigations, review and quizzes have separate sessions.
Part 1 · Trace a speaker’s linked interactions
A current is the rate at which charge passes a point. In a coil of wire it produces a magnetic influence that interacts with a permanent magnet. Changing the current can change the direction or size of force on the coil. A coil attached to a membrane can move it back and forth.
Read the visual model
Why does a fixed magnet alone not explain a complete changing sound?
Visual reasoning — after your attempt
The time-varying input and resulting changing force are also needed to produce the membrane’s varying motion and air disturbance.
Draw electrical input → coil–magnet interaction → membrane vibration → air disturbance → receiver. Use a separate arrow key for energy transfer and information pattern. A static magnet alone does not reproduce a changing music signal.
Pause and explain
Why does a fixed magnet alone not explain a complete changing sound?
Check your reasoning after answering
The time-varying input and resulting changing force are also needed to produce the membrane’s varying motion and air disturbance.
Part 2 · Separate a carrier from its information
A wave can carry a patterned change that a receiver interprets. A carrier is the physical process transmitting the pattern. Light can carry information across a vacuum; ordinary sound requires matter. Faster wave travel is not the same as clearer meaning or a larger data capacity.
Read the visual model
A signal is an observable changing pattern used to convey information. A code links a pattern to meaning. Explain both the physical mechanism carrying it and the rule used to interpret it.
Would a receiver that has never learned the three-pulse code automatically know the message? What information is missing?
Visual reasoning — after your attempt
No. It can detect a pattern but needs the agreed code/context to interpret ready. Physical detection and message interpretation are different steps.
A flashlight can encode a short message using agreed short and long flashes. The light transfers energy; the sequence represents information only because the sender and receiver share a code. A flash alone has no universal sentence meaning.
Pause and explain
What must two people agree on before flashes form a reliable message?
Check your reasoning after answering
The encoding rules, timing and how to distinguish message boundaries and symbols; the physical carrier alone does not define the meaning.
Part 3 · Compare analog and digital representations
An analog representation varies continuously, such as a plotted microphone voltage. A digital representation uses discrete symbols such as 0 and 1. Discrete means separated allowed values. A threshold is the rule that assigns a measured value to a symbol; real noise can push a reading across that rule.
Read the visual model
Analog represents a continuously varying quantity. A digital representation uses discrete encoded values. Explain which aspects are stored, what is omitted and what a receiver needs to reconstruct an approximation.
Name one way this sampled record differs from the continuous pattern. Would using more samples alone remove the coarse level rounding?
Visual reasoning — after your attempt
It omits values between sample times and rounds levels. More samples improve time coverage but do not by themselves add more allowed amplitude levels.
An illustrative receiver uses readings below 0.5 as 0 and at least 0.5 as 1. Measurements 0.1, 0.8, 0.2, 0.9 decode as 0101. Measurement 0.49 is close to the threshold and can be less reliable than 0.1.
Pause and explain
Does digital transmission prevent all error?
Check your reasoning after answering
No. Noise can cause incorrect symbol decisions, especially near a threshold. Reliability depends on the system and code, not merely the digital label.
Part 4 · Revise a complete system model
A system explanation includes components, interactions, transfer paths and limitations. Breaks at different points have different consequences: an open circuit can remove the input current, a loose membrane connection can prevent its intended motion, and a vacuum removes the ordinary air sound path.
Read the visual model
A complete system explanation predicts how a change at one part influences the next. Use observations from more than one stage to localize a problem. Revising the model requires testing the proposed cause, not simply renaming a box.
If current varies and the coil moves but the cone stays still, which connection should the revised model investigate first?
Visual reasoning — after your attempt
Investigate how the cone is mechanically attached to the moving coil, while checking that the reported motion records are reliable. The failure is not automatically in air propagation.
In a supplied vacuum comparison, magnets can still interact while no ordinary airborne sound crosses an empty gap. The magnetic force and sound transmission need different models. Use evidence about the actual gap rather than claim that all effects require air.
Pause and explain
What distinguishes the sound pathway from the magnetic pathway?
Check your reasoning after answering
Sound requires material interactions in a medium. Magnetic interactions can occur across a vacuum; the two effects do not share the same air requirement.
Apply the whole unit · Decode and critique a speaker model
Illustrative case for analysis, not measurements collected by the learner. Illustrative received values are 0.15, 0.85, 0.48 and 0.88 with threshold 0.5. A drawing shows electrical input jumping directly to an ear with no speaker or air.
Your task
Decode the values, identify the less robust reading and revise the drawing with intermediate interactions. Use the supplied conditions, show intermediate reasoning and distinguish the supported conclusion from a broader claim.
What your response should show
- Use the specified quantities and units.
- Explain an intermediate step or comparison.
- Connect the pattern to the physical mechanism.
- State an assumption or limitation.
Response guidance — after your attempt
Apply the threshold separately: 0.15→0, 0.85→1, 0.48→0, 0.88→1, giving 0101.
Compare proximity to 0.5: 0.48 is only 0.02 away and most sensitive to a small noise change.
Add electrical input, coil–magnet interaction, membrane vibration, successive air interactions and receiver.
Distinguish information and energy pathways from a claim that charge or one air parcel travels the whole route.
The decoded sequence is 0101. The 0.48 value is closest to the threshold, so small noise could change its symbol. Add the coil–magnet interaction, attached membrane vibration, successive air interactions and receiver. The drawing should not imply that charge or air particles travel the entire information path unchanged.
Scientific references and adapted teaching resources
- OpenSciEd 8.2 Sound Waves — public unit overview
- OpenSciEd 8.3 Forces at a Distance — public unit overview
- OpenSciEd instructional model — storyline routines
- Creative Commons Attribution 4.0 — middle-school material license
Parent / teacher teaching notes
Ask the learner to describe the phenomenon before naming a formula. Discuss each checkpoint after an attempt. Use the supplied records when equipment is unavailable and label them illustrative rather than actual measurements. The final explanation should identify a mechanism and a limit, with different defensible wording accepted. Adaptation credit: OpenSciEd middle-school teaching routines and public task structures by OpenSciEd, CC BY 4.0. This independent version adds original explanatory text, data and figures, terminology support and a home-study schedule. It does not reproduce the complete teacher editions or their classroom validation.
The key idea
Noise can cause a reading to cross the decision threshold; a code and receiver design influence error detection and reliability. The decoded sequence is 0101.
Worked examples
Example 1 · Build the first reasoning step
- Identify what the question asks and what the stated observation establishes.
- The time-varying input and resulting changing force are also needed to produce the membrane’s varying motion and air disturbance.
Example 2 · Decode and critique a speaker model
- Apply the threshold separately: 0.15→0, 0.85→1, 0.48→0, 0.88→1, giving 0101.
- Compare proximity to 0.5: 0.48 is only 0.02 away and most sensitive to a small noise change.
- Add electrical input, coil–magnet interaction, membrane vibration, successive air interactions and receiver.
- Distinguish information and energy pathways from a claim that charge or one air parcel travels the whole route.
Explain why each stated condition matters.
Example 3 · Transfer to a different condition
- Identify the changed condition.
- No. Magnetic fields can mediate an interaction through a vacuum, while ordinary sound requires a material medium. Different mechanisms predict the different observations.
Example 4 · Find and fix the mistake
- Distinguish what is observed from what is inferred.
- Noise can cause a reading to cross the decision threshold; a code and receiver design influence error detection and reliability.
Compare the claim with the stated observations and model assumptions.
Example 5 · Interpret the visual model
- Identify the represented objects, axes, labeled quantities and stated conditions before choosing a rule.
- A signal is an observable changing pattern used to convey information. A code links a pattern to meaning. Explain both the physical mechanism carrying it and the rule used to interpret it.
- No. It can detect a pattern but needs the agreed code/context to interpret ready. Physical detection and message interpretation are different steps.
Keep the model’s stated limits explicit: Three pulses form a changing physical pattern. Under the explicitly chosen classroom code they mean ready. The material disturbance is the carrier, while the meaning depends on a shared code and receiver. A different code could assign different meaning to the same pulses. Changing pulse size within a readable range need not change the encoded pulse count.
Avoid these mistakes
- Noise can cause a reading to cross the decision threshold; a code and receiver design influence error detection and reliability.
- Do not treat a schematic drawing as a scale measurement or a universal guarantee.
- Keep the stated comparison conditions and measurement boundary explicit.
- A correct numerical result needs units and an explanation of its meaning.
Check your understanding
Why does a fixed magnet alone not explain a complete changing sound?
Discuss the answer
The time-varying input and resulting changing force are also needed to produce the membrane’s varying motion and air disturbance.
What must two people agree on before flashes form a reliable message?
Discuss the answer
The encoding rules, timing and how to distinguish message boundaries and symbols; the physical carrier alone does not define the meaning.
Does digital transmission prevent all error?
Discuss the answer
No. Noise can cause incorrect symbol decisions, especially near a threshold. Reliability depends on the system and code, not merely the digital label.
What distinguishes the sound pathway from the magnetic pathway?
Discuss the answer
Sound requires material interactions in a medium. Magnetic interactions can occur across a vacuum; the two effects do not share the same air requirement.
Return to the phenomenon
Illustrative received values are 0.15, 0.85, 0.48 and 0.88 with threshold 0.5. A drawing shows electrical input jumping directly to an ear with no speaker or air. Decode the values, identify the less robust reading and revise the drawing with intermediate interactions. Revise your first explanation using a named idea from the lesson. Mark the changed part and the evidence that supports it.
Compare explanations after your attempt
The decoded sequence is 0101. The 0.48 value is closest to the threshold, so small noise could change its symbol. Add the coil–magnet interaction, attached membrane vibration, successive air interactions and receiver. The drawing should not imply that charge or air particles travel the entire information path unchanged.
What should we investigate next?
Which condition could be changed to test a remaining uncertainty in this explanation? State the predicted observation and what result would challenge your model.
Investigate, explain and revise
Use these tasks after the three teaching sessions as needed. Discuss an attempted explanation before opening response guidance; a matching sentence is less important than a supported mechanism.
Activity 1 · Explain the new evidence case
Use the visible scenario above, Parts 1–4 and your first notebook model. No outside reading or equipment is required.
Your task
Illustrative received values are 0.15, 0.85, 0.48 and 0.88 with threshold 0.5. A drawing shows electrical input jumping directly to an ear with no speaker or air. Decode the values, identify the less robust reading and revise the drawing with intermediate interactions. Write 100–150 words or give a labeled drawing with an equivalent oral explanation.
Success criteria
- Use two relevant stated records or conditions.
- Explain the mechanism rather than only repeat a definition.
- Label observation and inference.
- Name a changed model feature or a remaining uncertainty.
Hint
Read the stated boundary and conditions before selecting a relationship. The unit’s worked examples show intermediate steps.
Response guidance — discuss after your attempt
The decoded sequence is 0101. The 0.48 value is closest to the threshold, so small noise could change its symbol. Add the coil–magnet interaction, attached membrane vibration, successive air interactions and receiver. The drawing should not imply that charge or air particles travel the entire information path unchanged.
Activity 2 · Read and extend the figure
Study the new labeled figure and its caption, then compare it with the associated teaching part.
Your task
What fails if the ordinary sound path becomes a vacuum gap? Explain what each important label represents. Add one missing feature that would be needed for a different question, and explain why the original figure leaves it out.
Success criteria
- Answer the figure question with its stated labels.
- Connect the visual representation to the scientific idea.
- Identify a specific limitation from the caption.
- Propose a useful change without misrepresenting supplied evidence.
Hint
The sequence links a changing input, magnetic interaction, membrane motion and air sound transfer. The boxes name components and mechanisms rather than show a physical scale or actual circuit wiring. The same information pattern is represented through different processes; charge is not transmitted unchanged into the ear.
Response guidance — discuss after your attempt
The air-medium sound transfer fails even though magnetic interactions can still occur across a vacuum. The model needs separate mechanisms for those links. The sequence links a changing input, magnetic interaction, membrane motion and air sound transfer. The boxes name components and mechanisms rather than show a physical scale or actual circuit wiring. The same information pattern is represented through different processes; charge is not transmitted unchanged into the ear.
Words to know
- signal
- Changing physical pattern used to carry information.
- membrane
- Thin surface capable of moving or vibrating.
- analog
- Continuously varying representation.
- digital
- Representation using discrete permitted symbols.
- threshold
- Decision boundary for assigning a measurement to a category or symbol.
- model
- A representation that explains selected features and makes predictions; it leaves other details out.
- evidence
- Relevant observations or records used to support or challenge a claim.
- system boundary
- The chosen limit separating the objects being studied from their surroundings.
- assumption
- A condition taken as true for a model or calculation and needing to be checked against the case.
In the real world
Illustrative received values are 0.15, 0.85, 0.48 and 0.88 with threshold 0.5. A drawing shows electrical input jumping directly to an ear with no speaker or air.
Exit check
What fails if the ordinary sound path becomes a vacuum gap? Explain the relevant mechanism and one model limitation.
Check your explanation after answering
The air-medium sound transfer fails even though magnetic interactions can still occur across a vacuum. The model needs separate mechanisms for those links. The sequence links a changing input, magnetic interaction, membrane motion and air sound transfer. The boxes name components and mechanisms rather than show a physical scale or actual circuit wiring. The same information pattern is represented through different processes; charge is not transmitted unchanged into the ear.
Explain your reasoning without notes. If a key idea is missing, revisit the lesson and try again.
Problem 1
Answer and explanation
Amplitude is 3 mm. The cycle count per time, and hence frequency of 200 Hz, is unchanged in this comparison.
Amplitude is 3 mm. The cycle count per time, and hence frequency of 200 Hz, is unchanged in this comparison.
Response criteria
- Use the supplied conditions and relevant evidence.
- Explain the scientific mechanism or calculation.
- State a meaningful limitation or testable next step.
Problem 2
Answer and explanation
C has the highest frequency, 300 Hz; B has the largest displacement amplitude, 3 mm. The two properties are independent in this comparison.
C has the highest frequency, 300 Hz; B has the largest displacement amplitude, 3 mm. The two properties are independent in this comparison.
Response criteria
- Use the supplied conditions and relevant evidence.
- Explain the scientific mechanism or calculation.
- State a meaningful limitation or testable next step.
Problem 3
Answer and explanation
Period 0.2 s; frequency 5 Hz; amplitude 3 mm; peak-to-trough span 6 mm. The source moves locally rather than traveling across the sound path.
Use matching-peak separation for period and its reciprocal for frequency.
Measure amplitude from the middle position to a peak.
Period 0.2 s; frequency 5 Hz; amplitude 3 mm; peak-to-trough span 6 mm. The source moves locally rather than traveling across the sound path.
Response criteria
- Use the named labels, directions or supplied quantities accurately.
- Connect the visual evidence to the scientific mechanism or calculation.
- State the relevant model conditions or limitation.
Problem 4
Answer and explanation
Amplitude measures maximum displacement from equilibrium. For a symmetric wave the full crest-to-trough height is twice the amplitude.
Amplitude measures maximum displacement from equilibrium. For a symmetric wave the full crest-to-trough height is twice the amplitude.
Response criteria
- Use the supplied conditions and relevant evidence.
- Explain the scientific mechanism or calculation.
- State a meaningful limitation or testable next step.
Problem 5
Answer and explanation
No. Frequency requires cycles per time, not merely the number of crests in a spatial drawing.
No. Frequency requires cycles per time, not merely the number of crests in a spatial drawing.
Response criteria
- Use the supplied conditions and relevant evidence.
- Explain the scientific mechanism or calculation.
- State a meaningful limitation or testable next step.
Problem 6
Answer and explanation
Speed 0.8×5 = 4 m/s. The represented energy increases by a factor of four under the stated matched squared-amplitude comparison.
Combine a spatial repeat and a temporal repeat.
Keep all named comparison conditions fixed before using the amplitude pattern.
Speed 0.8×5 = 4 m/s. The represented energy increases by a factor of four under the stated matched squared-amplitude comparison.
Response criteria
- Use the named labels, directions or supplied quantities accurately.
- Connect the visual evidence to the scientific mechanism or calculation.
- State the relevant model conditions or limitation.
Problem 7
Answer and explanation
Under comparable conditions its intensity and perceived loudness generally increase, while its basic pitch remains linked to the unchanged frequency.
Under comparable conditions its intensity and perceived loudness generally increase, while its basic pitch remains linked to the unchanged frequency.
Response criteria
- Use the supplied conditions and relevant evidence.
- Explain the scientific mechanism or calculation.
- State a meaningful limitation or testable next step.
Problem 8
Answer and explanation
No. Successive interactions can transfer the disturbance while the particles mainly move near their local positions.
No. Successive interactions can transfer the disturbance while the particles mainly move near their local positions.
Response criteria
- Use the supplied conditions and relevant evidence.
- Explain the scientific mechanism or calculation.
- State a meaningful limitation or testable next step.
Problem 9
Answer and explanation
Round-trip length is 340×0.3 = 102 m, so reflector distance is 51 m. The measured time includes travel out and back.
Draw both travel legs.
Divide total path by two only under the stated same-path out-and-back comparison.
Round-trip length is 340×0.3 = 102 m, so reflector distance is 51 m. The measured time includes travel out and back.
Response criteria
- Use the named labels, directions or supplied quantities accurately.
- Connect the visual evidence to the scientific mechanism or calculation.
- State the relevant model conditions or limitation.
Problem 10
Answer and explanation
Frequency sets energy per photon, while photon quantity, intensity, and exposure duration affect total delivery. Interaction with material also matters.
Frequency sets energy per photon, while photon quantity, intensity, and exposure duration affect total delivery. Interaction with material also matters.
Response criteria
- Use the supplied conditions and relevant evidence.
- Explain the scientific mechanism or calculation.
- State a meaningful limitation or testable next step.
Problem 11
Answer and explanation
It omits the reflected 25 and absorbed 15 units, preventing a complete energy account.
It omits the reflected 25 and absorbed 15 units, preventing a complete energy account.
Response criteria
- Use the supplied conditions and relevant evidence.
- Explain the scientific mechanism or calculation.
- State a meaningful limitation or testable next step.
Problem 12
Answer and explanation
Absorbed amount is 120−30−70 = 20 units. Appearance depends on the incident wavelengths and the surface’s reflection toward the observer; a different lamp can change it.
Keep reflected, transmitted and absorbed pathways distinct.
Name both source and surface in a color explanation.
Absorbed amount is 120−30−70 = 20 units. Appearance depends on the incident wavelengths and the surface’s reflection toward the observer; a different lamp can change it.
Response criteria
- Use the named labels, directions or supplied quantities accurately.
- Connect the visual evidence to the scientific mechanism or calculation.
- State the relevant model conditions or limitation.
Problem 13
Answer and explanation
The encoding rules, timing and how to distinguish message boundaries and symbols; the physical carrier alone does not define the meaning.
The encoding rules, timing and how to distinguish message boundaries and symbols; the physical carrier alone does not define the meaning.
Response criteria
- Use the supplied conditions and relevant evidence.
- Explain the scientific mechanism or calculation.
- State a meaningful limitation or testable next step.
Problem 14
Answer and explanation
The air-medium sound transfer fails even though magnetic interactions can still occur across a vacuum. The model needs separate mechanisms for those links.
The air-medium sound transfer fails even though magnetic interactions can still occur across a vacuum. The model needs separate mechanisms for those links.
Response criteria
- Use the supplied conditions and relevant evidence.
- Explain the scientific mechanism or calculation.
- State a meaningful limitation or testable next step.
Problem 15
Answer and explanation
Changes between sample times and finer level differences are lost. Faster sampling improves temporal coverage but does not add more allowed amplitude levels; the encoding and reconstruction also matter.
Separate sampling times from quantized levels.
State which omitted detail each proposed change addresses.
Changes between sample times and finer level differences are lost. Faster sampling improves temporal coverage but does not add more allowed amplitude levels; the encoding and reconstruction also matter.
Response criteria
- Use the named labels, directions or supplied quantities accurately.
- Connect the visual evidence to the scientific mechanism or calculation.
- State the relevant model conditions or limitation.