Phases of Matter — Print · Physical Science: Matter, Forces & Energy, Grade 8
Explain solids, liquids, gases, and changes of state using particle motion and energy transfer.
Printable chapter lessons and review.
States of Matter & Phase Changes
Learning goals
- I can describe how particle arrangement and motion differ in solids, liquids, and gases.
- I can name the phase changes and describe what happens to temperature and energy during each.
Readings for this unit
Before this unit
Describe solids, liquids and gases using particles.
Use three teaching sessions of about 40–45 minutes: first observe the phenomenon, draft a model and study Parts 1–2; next explain Parts 3–4 with the figures and evidence; then work the application, examples, practice, model revision and exit check. Divide any difficult part into smaller steps and revisit after feedback. Investigations, review and quizzes have separate sessions. Study the four visual parts across the scheduled sessions, then use the illustrated worked case and independent transfer questions. Extend or revisit a session when the learner cannot explain the figure; completion time is a proposed allocation, not a mastery guarantee.
Start with something to explain
What would explain the observations in states of matter & phase changes?
Illustrative evidence case. A supplied sealed-water model contains 50 g solid, then 30 g solid plus 20 g liquid, then 50 g liquid. The chemical formula remains H₂O throughout.
Notice and wonder
What changes without changing particle identity? Write two observations from the supplied record without guessing their cause. Include a quantity and its unit when given. An observation is what was recorded; an inference is what you think explains it.
Write one question about why the pattern occurs and one question about a comparison that could distinguish competing explanations. A testable question identifies what could be observed or measured.
Your first model
Before reading the model answer, sketch the named objects or particles and label what you think changes. Track mass, identity and arrangement across the three records. Explain what a particle drawing should change and what it should keep. Keep this first version so you can compare it with your later explanation.
Build the language from the idea
- solid
- A state of matter with a fixed shape and volume; particles vibrate in place, tightly packed.
- liquid
- A state of matter with a fixed volume but no fixed shape; particles are close but can flow past each other.
- gas
- A state of matter with no fixed shape or volume; particles are far apart and move freely and quickly.
- melting point
- The temperature at which a solid turns into a liquid.
- boiling point
- The temperature at which a liquid turns into a gas throughout the whole liquid.
- condensation
- The phase change from gas to liquid.
- thermal energy
- Internal energy associated with random particle motion and particle interactions; temperature alone does not give its total amount.
- model
- A representation that explains selected features and makes predictions; it leaves other details out.
- evidence
- Relevant observations or records used to support or challenge a claim.
- system boundary
- The chosen limit separating the objects being studied from their surroundings.
- assumption
- A condition taken as true for a model or calculation and needing to be checked against the case.
Many everyday materials are described using three familiar states — solid, liquid, or gas — and the real difference between them comes down to how the tiny particles inside are arranged and how fast they're moving. In a solid, the particles are packed tightly and locked into fixed positions, so all they can do is vibrate in place; that's why a solid keeps its own shape. In a liquid, the particles are still close together but no longer locked down, so they can slide and tumble past one another — which is why a liquid flows and takes the shape of its container while keeping the same volume. In a gas, the particles have broken free almost entirely, zooming around with lots of empty space between them, so a gas spreads out to fill whatever container it's in.
The state of a substance depends on conditions including temperature and pressure, and on interactions between its particles. Heating can increase average particle kinetic energy and temperature, but during a phase change energy can instead change particle interactions and arrangement. Thermal energy includes particle motion and interactions; it is not simply another name for temperature. Particles do not become bigger when a material expands, and substances such as water can behave differently from a simple always-closer-on-cooling rule.
When enough energy is added or removed, a substance flips from one state to another in a phase change. Adding energy drives the changes that loosen particles: melting turns a solid into a liquid at its melting point, and boiling turns a liquid into a gas at its boiling point (evaporation does the same thing more gently, only at the surface). Removing energy runs these in reverse — freezing turns a liquid back into a solid, and condensation turns a gas back into a liquid, which is the fog you see forming on a cold bathroom mirror. Two less common shortcuts skip the liquid stage entirely: sublimation goes straight from solid to gas (dry ice does this), and deposition goes straight from gas to solid.
For a pure substance at fixed pressure, temperature can remain nearly constant during melting or boiling while energy continues to enter. During melting, solid and liquid may coexist while particle arrangements and interactions change. After the phase change is complete, further heating can raise temperature again. Real samples, mixtures, pressure changes, and unequal heating may produce a less sharply defined plateau, so check the conditions before assuming that every phase change has a perfectly flat temperature record.
This is why one substance, water, can be solid ice, liquid water, or gaseous water vapor without ever becoming a different chemical — it's the very same H₂O molecules the whole time, just arranged and moving differently. Understanding how adding or removing energy shuffles particles between these states is the key to everything from why sweating cools you down to how clouds and rain take shape in the sky.
During a phase change, particles remain the same chemical substance while their arrangement and interactions change. Melting water does not turn water molecules into hydrogen and oxygen. Particle diagrams should change spacing and organization while retaining the same labeled particles.
For a pure substance at fixed pressure, temperature can stay nearly constant during melting or boiling while energy is transferred. The energy changes interactions between particles. Outside a phase change, heating generally increases temperature. Mixtures can melt across a range instead of at one sharp point.
Evaporation happens at a liquid's surface at temperatures below boiling. Faster particles can escape, cooling the remaining liquid. Boiling occurs throughout the liquid when its vapor pressure reaches the surrounding pressure. A change in air pressure can therefore change boiling temperature.
Build your understanding
Where this fits
This unit helps answer the chapter question: How can adding or removing energy change matter? Keep a notebook table with the question, evidence, explanation and one unresolved issue. Revise a previous model only when you can name the new evidence or idea that changes it.
Use three teaching sessions of about 40–45 minutes: first observe the phenomenon, draft a model and study Parts 1–2; next explain Parts 3–4 with the figures and evidence; then work the application, examples, practice, model revision and exit check. Divide any difficult part into smaller steps and revisit after feedback. Investigations, review and quizzes have separate sessions.
Part 1 · Represent the same particles in different states
In a solid, particles vibrate around relatively fixed positions. In a liquid, particles remain close but change neighbors. In a gas, particles are much farther apart on average and move through the available space. This model explains shape, flow, and compressibility without turning particles themselves into miniature solid or liquid objects.
Read the visual model
What changes when liquid water freezes, and what remains the same?
Visual reasoning — after your attempt
The molecular arrangement and motion change. The molecules remain water molecules, and the total mass stays the same if none enters or leaves the system.
Draw the same number and kind of water molecules in three equal-area panels. Change their arrangement and spacing, not their identity or drawn size. Real water expands on freezing; the familiar claim that every solid is denser than its liquid has exceptions.
Pause and explain
What changes when liquid water freezes, and what remains the same?
Check your reasoning after answering
The molecular arrangement and motion change. The molecules remain water molecules, and the total mass stays the same if none enters or leaves the system.
Part 2 · Distinguish evaporation from boiling
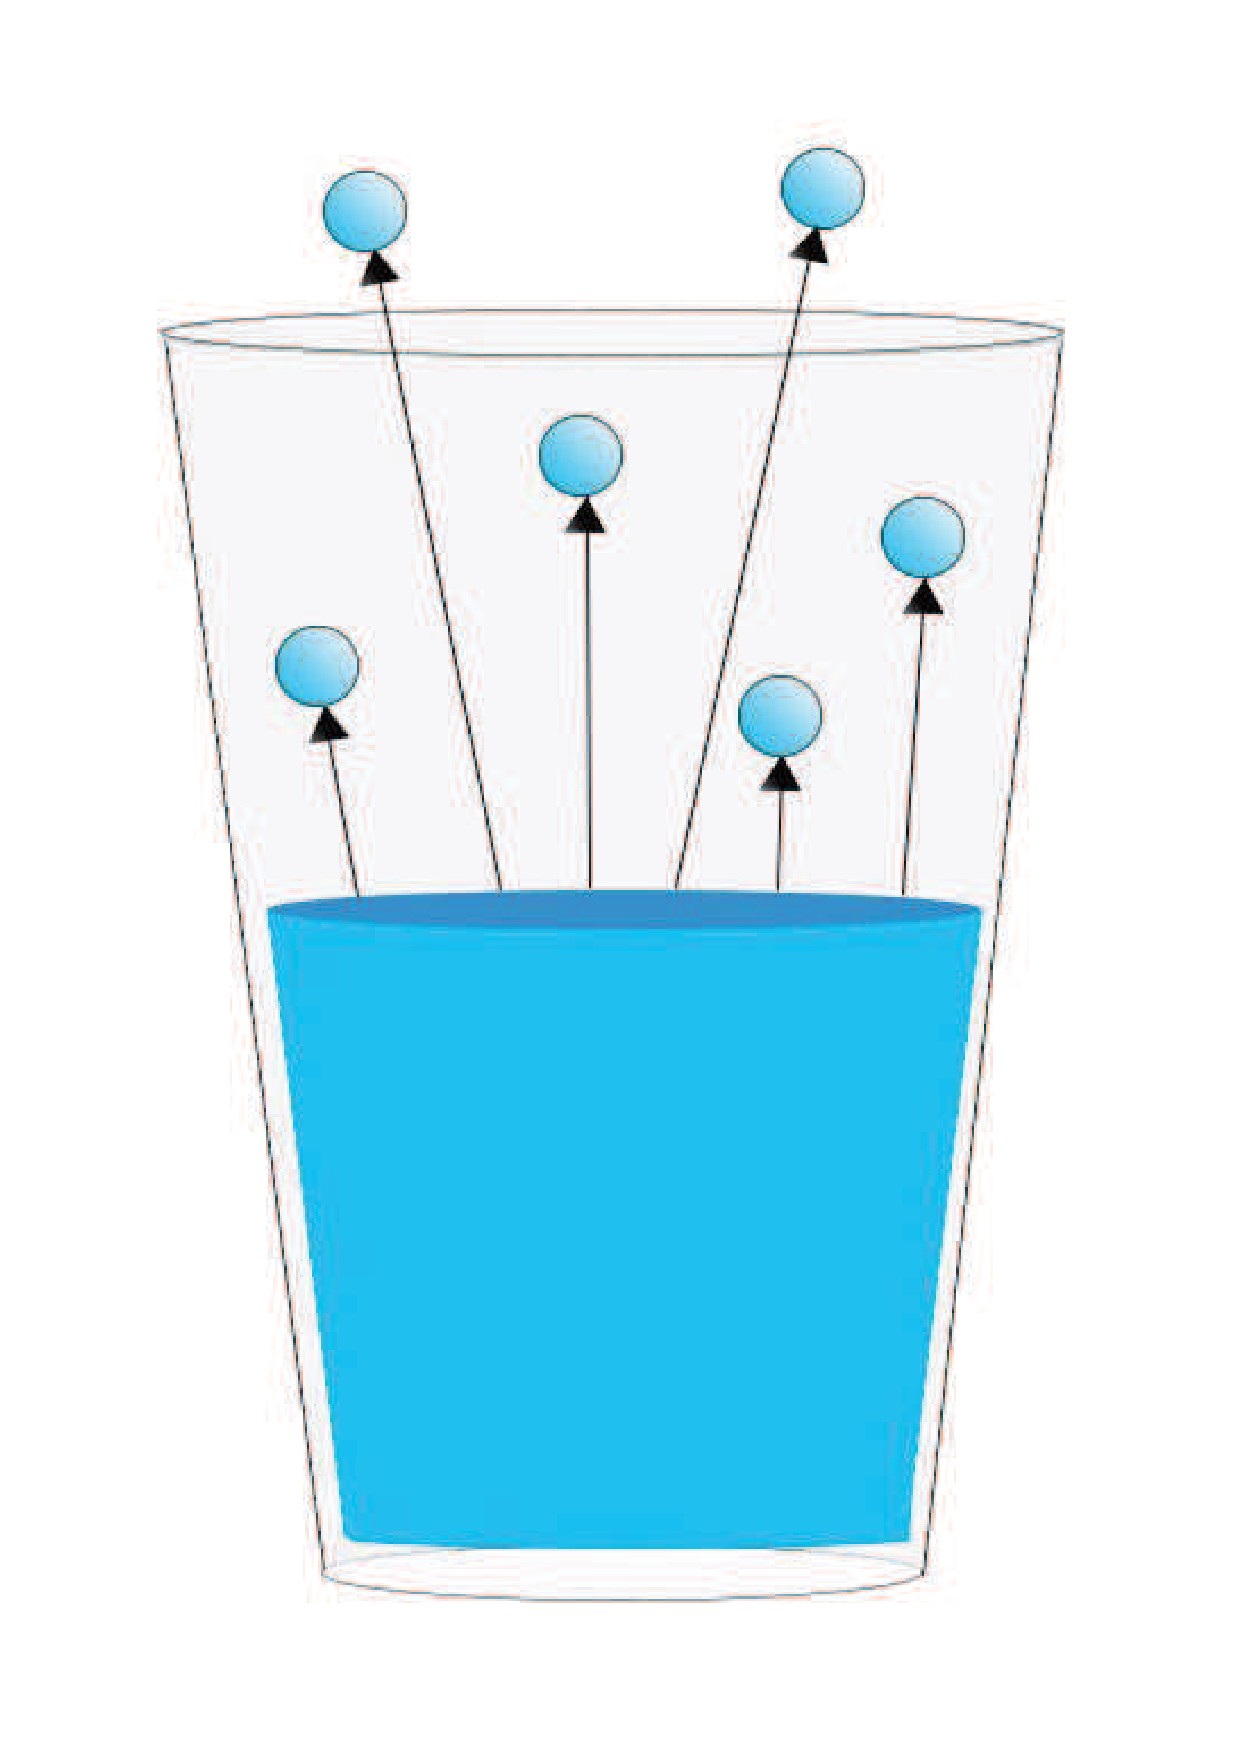
Evaporation occurs at a liquid surface, including below boiling temperature. Some molecules escape into the gas phase. Boiling occurs throughout the liquid when vapor pressure matches surrounding pressure. Temperature, exposed surface, and air movement can affect evaporation, so a fair comparison changes only the factor being tested.
Read the visual model
Bulk means the material away from only its outer surface. Water vapor is gaseous water and is invisible; visible mist consists mainly of small liquid droplets. The model separates these ideas without asking the learner to boil water.
Which feature distinguishes these two modeled phase changes, and why would a bubble from an unknown mixture need other evidence?
Visual reasoning — after your attempt
Surface-only escape versus vapor-bubble formation within the liquid distinguishes these cases. Unknown bubbles could arise from other processes, so gas identity and conditions must be established.
A wet towel dries at room temperature without boiling. Spread-out water can evaporate faster than the same amount in a narrow container under otherwise comparable conditions. The water molecules move into the air; they have not been destroyed.
Pause and explain
How can water disappear from an open dish without reaching 100°C?
Check your reasoning after answering
Surface molecules can escape by evaporation below boiling temperature. They enter the surrounding air as water vapor.
Part 3 · Interpret a temperature plateau
For a pure substance at fixed pressure, melting or boiling can occur at nearly constant temperature while energy is transferred. The transferred energy changes interactions and arrangement rather than simply increasing average particle kinetic energy. Real samples and mixtures may not show a perfectly flat plateau.
Read the visual model
Why can heating continue while temperature stays nearly constant?
Visual reasoning — after your attempt
During a phase change, energy can change particle interactions and arrangement while average kinetic energy, and therefore temperature, changes little.
On a temperature-time heating graph, a rising section indicates warming; a nearly flat melting section can indicate solid and liquid coexisting. A flat line does not mean the heater necessarily stopped supplying energy. Check what happened to the sample as well as the temperature.
Pause and explain
Why can heating continue while temperature stays nearly constant?
Check your reasoning after answering
During a phase change, energy can change particle interactions and arrangement while average kinetic energy, and therefore temperature, changes little.
Part 4 · Trace energy and matter through condensation
Water vapor is invisible. Visible mist contains tiny liquid droplets formed when vapor condenses. On a cold glass, water from surrounding air can condense on the outside; it need not have leaked through the glass. Condensation transfers energy from the condensing water to its surroundings.
Read the visual model
Condensation is a gas-to-liquid phase change. Keep chemical identity, water origin and energy transfer as separate questions. The container wall can be dry initially yet gain outside water without leaking from its interior.
Where do the droplets’ water and the transferred energy come from in this model?
Visual reasoning — after your attempt
The water comes from vapor in surrounding air. During condensation, energy transfers from the vapor/surrounding system toward the cooler wall; no new water is created.
Use a labeled before-and-after drawing with vapor outside the cup and droplets on the cold surface. A sealed cup of colored water can help distinguish a leak from outside condensation, but several observations are stronger than one picture.
Pause and explain
Are the visible white clouds above hot water water vapor itself?
Check your reasoning after answering
The visible cloud is mostly tiny condensed liquid droplets. Gaseous water vapor itself is invisible; the droplets form as warm moist air cools.
Apply the whole unit · Read a melting record
Illustrative record for a pure solid at fixed pressure: temperature rises from −5°C to 0°C, stays near 0°C while solid and liquid coexist, then rises to 8°C after the solid is gone. A heater supplies energy throughout.
Your task
Sketch and label the temperature-time pattern. Draw particle models for three stages, identify where phase change occurs, and explain energy transfer during the flat section. State one condition needed for this interpretation.
What your response should show
- Use the supplied observations and measurements accurately; include units where needed.
- Explain the science behind your answer, rather than giving only a number or label.
- Show a labeled model, calculation, or evidence comparison as requested.
- State an assumption or limitation and suggest a useful next measurement.
Response guidance — after your attempt
The graph rises, has a near-flat melting section, then rises again. During melting, added energy changes particle interactions while temperature changes little. Retain the same particle identities in all sketches. The interpretation assumes a pure substance, controlled pressure, and reliable temperature measurements; a mixture may show a broader melting range.
Scientific references and adapted teaching resources
- OpenSciEd 6.2 Thermal Energy — public unit overview
- OpenSciEd instructional model — storyline routines
- Creative Commons Attribution 4.0 — middle-school material license
Parent / teacher teaching notes
Use a graph and particle drawing together. Ask what the graph shows directly and what the model explains. Correct any drawing that enlarges molecules during heating or turns water into different elements. Adaptation credit: OpenSciEd middle-school teaching routines and public task structures by OpenSciEd, CC BY 4.0. This independent version adds original explanatory text, data and figures, terminology support and a home-study schedule. It does not reproduce the complete teacher editions or their classroom validation.
The key idea
Solid, liquid, and gas differ in particle spacing and motion; during a phase change, added or removed energy changes the state, not the temperature.
Worked examples
Example 1
- From −10°C to 0°C: the solid ice simply warms up, particles vibrating faster.
- At 0°C: the ice melts into liquid water. Temperature holds steady at 0°C the whole time it's melting, even though energy keeps flowing in.
- From 0°C to 20°C: once fully melted, the liquid water warms up normally to 20°C.
Example 2 · Worked application
- Before boiling, added energy increases average particle kinetic energy.
- During boiling, energy changes particle interactions while temperature is nearly constant.
- After vaporization, further heating can increase the gas temperature.
The particles remain the same chemical substance through the change.
Example 3
- Identify melting: the substance is changing from solid to liquid.
- Added energy changes particle interactions instead of mainly increasing average kinetic energy.
Example 4 · Find and fix the mistake
- Test the claim against the stated conditions: The particles remain the same chemical substance through the change.
- Energy can still enter during a phase change. Constant temperature does not mean constant total stored energy.
The particles remain the same chemical substance through the change.
Example 5 · Interpret the visual model
- Identify the represented objects, axes, labeled quantities and stated conditions before choosing a rule.
- Bulk means the material away from only its outer surface. Water vapor is gaseous water and is invisible; visible mist consists mainly of small liquid droplets. The model separates these ideas without asking the learner to boil water.
- Surface-only escape versus vapor-bubble formation within the liquid distinguishes these cases. Unknown bubbles could arise from other processes, so gas identity and conditions must be established.
Keep the model’s stated limits explicit: Evaporation selects surface particles escaping from liquid and can occur below boiling. In the specified boiling-water model, vapor bubbles form in the liquid’s bulk. Both are phase changes retaining water identity. Bubble size and selected particles are schematic, and neither drawing says visible white fog is invisible gas molecules or that all bubbling processes are boiling.
Avoid these mistakes
- Evaporation does not require the liquid to reach its boiling point.
Check your understanding
Ice and liquid water coexist at about 0°C at normal atmospheric pressure while heat is added. Why does the temperature stay nearly constant?
Discuss the answer
Energy is used in melting while both phases remain; temperature rises after the ice has melted if heating continues.
What changes in a particle model when ice melts, and what stays the same?
Discuss the answer
During a phase change, particles remain the same chemical substance while their arrangement and interactions change. Melting water does not turn water molecules into hydrogen and oxygen. Particle diagrams should change spacing and organization while retaining the same labeled particles. For a pure substance at fixed pressure, temperature can stay nearly constant during melting or boiling while energy is transferred. The energy changes interactions between particles. Outside a phase change, heating generally increases temperature. Mixtures can melt across a range instead of at one sharp point.
Return to the phenomenon
A supplied sealed-water model contains 50 g solid, then 30 g solid plus 20 g liquid, then 50 g liquid. The chemical formula remains H₂O throughout. Track mass, identity and arrangement across the three records. Explain what a particle drawing should change and what it should keep. Revise your first explanation using a named idea from the lesson. Mark the changed part and the evidence that supports it.
Compare explanations after your attempt
Each record accounts for 50 g water. Melting changes particle arrangement and freedom of movement while retaining H₂O identity. Show a larger liquid fraction through the sequence; do not enlarge individual molecules or turn them into new elements. A drawing with a handful of dots stands for many molecules and is not to scale.
What should we investigate next?
Which condition could be changed to test a remaining uncertainty in this explanation? State the predicted observation and what result would challenge your model.
Investigate, explain and revise
Use these tasks after the three teaching sessions as needed. Discuss an attempted explanation before opening response guidance; a matching sentence is less important than a supported mechanism.
Activity 1 · Explain the new evidence case
Use the visible scenario above, Parts 1–4 and your first notebook model. No outside reading or equipment is required.
Your task
A supplied sealed-water model contains 50 g solid, then 30 g solid plus 20 g liquid, then 50 g liquid. The chemical formula remains H₂O throughout. Track mass, identity and arrangement across the three records. Explain what a particle drawing should change and what it should keep. Write 100–150 words or give a labeled drawing with an equivalent oral explanation.
Success criteria
- Use two relevant stated records or conditions.
- Explain the mechanism rather than only repeat a definition.
- Label observation and inference.
- Name a changed model feature or a remaining uncertainty.
Hint
Read the stated boundary and conditions before selecting a relationship. The unit’s worked examples show intermediate steps.
Response guidance — discuss after your attempt
Each record accounts for 50 g water. Melting changes particle arrangement and freedom of movement while retaining H₂O identity. Show a larger liquid fraction through the sequence; do not enlarge individual molecules or turn them into new elements. A drawing with a handful of dots stands for many molecules and is not to scale.
Activity 2 · Read and extend the figure
Study the new labeled figure and its caption, then compare it with the associated teaching part.
Your task
What changes without changing particle identity? Explain what each important label represents. Add one missing feature that would be needed for a different question, and explain why the original figure leaves it out.
Success criteria
- Answer the figure question with its stated labels.
- Connect the visual representation to the scientific idea.
- Identify a specific limitation from the caption.
- Propose a useful change without misrepresenting supplied evidence.
Hint
The dots stand for particles and are not to scale or literal colors. The same substance can change arrangement and freedom of movement while retaining particle identity. Solid particles vibrate, liquids remain close but rearrange, and gases are more widely separated.
Response guidance — discuss after your attempt
Spacing, arrangement and allowed motion can change. In the gas compression model, volume changes while particle number and temperature are held fixed. The dots stand for particles and are not to scale or literal colors. The same substance can change arrangement and freedom of movement while retaining particle identity. Solid particles vibrate, liquids remain close but rearrange, and gases are more widely separated.
Words to know
- solid
- A state of matter with a fixed shape and volume; particles vibrate in place, tightly packed.
- liquid
- A state of matter with a fixed volume but no fixed shape; particles are close but can flow past each other.
- gas
- A state of matter with no fixed shape or volume; particles are far apart and move freely and quickly.
- melting point
- The temperature at which a solid turns into a liquid.
- boiling point
- The temperature at which a liquid turns into a gas throughout the whole liquid.
- condensation
- The phase change from gas to liquid.
- thermal energy
- Internal energy associated with random particle motion and particle interactions; temperature alone does not give its total amount.
- model
- A representation that explains selected features and makes predictions; it leaves other details out.
- evidence
- Relevant observations or records used to support or challenge a claim.
- system boundary
- The chosen limit separating the objects being studied from their surroundings.
- assumption
- A condition taken as true for a model or calculation and needing to be checked against the case.
The hidden 'plateau' when ice melts
If you heat a beaker of ice and graph temperature over time, you'll see something strange: the temperature stops rising at 0°C even though you keep adding heat. That flat plateau is the ice melting. All the incoming energy is going into breaking the bonds holding the solid together, not raising the temperature. Only once every bit of ice is liquid does the temperature start climbing again. The same plateau appears at 100°C during boiling. This 'hidden' energy is called latent heat.
Why sweating cools you down
Evaporation is secretly a cooling machine. When the fastest-moving water molecules escape from your skin as vapor, they carry away energy, leaving the slower (cooler) molecules behind. That's why you feel cold stepping out of a pool, and why sweating works: your body uses evaporative cooling to dump heat. It's also why rubbing alcohol feels icy — it evaporates even faster than water.
The fourth (and most common) state of matter
Solid, liquid, gas — and plasma. If you heat a gas hot enough, electrons rip away from atoms, creating a glowing, electrically charged soup. It sounds exotic, but plasma is actually the most common state of matter in the universe: every star, including the Sun, is plasma. On Earth you see it in lightning, neon signs, and the flame of a candle's hottest region.
Sublimation: skipping the liquid entirely
Some substances jump straight from solid to gas without ever becoming a liquid — that's sublimation. Dry ice (frozen carbon dioxide) does this, which is why it produces that spooky fog with no puddle. It happens because at normal air pressure, CO₂ has no stable liquid form. The reverse, gas straight to solid, is deposition — it's how frost forms on a cold window overnight.
In the real world
Meteorologists track evaporation and condensation in the atmosphere to help predict clouds, fog, and rain.
Exit check
What changes without changing particle identity? Explain the relevant mechanism and one model limitation.
Check your explanation after answering
Spacing, arrangement and allowed motion can change. In the gas compression model, volume changes while particle number and temperature are held fixed. The dots stand for particles and are not to scale or literal colors. The same substance can change arrangement and freedom of movement while retaining particle identity. Solid particles vibrate, liquids remain close but rearrange, and gases are more widely separated.
Explain your reasoning without notes. If a key idea is missing, revisit the lesson and try again.
Temperature & Thermal Energy
Learning goals
- I can distinguish temperature from the total thermal energy of a sample.
- I can predict the direction of energy transfer between objects at different temperatures.
- I can plan separate material and mass temperature-change comparisons.
Readings for this unit
Before this unit
Recognize that particles move and that measurements need units.
Use three teaching sessions of about 40–45 minutes: first observe the phenomenon, draft a model and study Parts 1–2; next explain Parts 3–4 with the figures and evidence; then work the application, examples, practice, model revision and exit check. Divide any difficult part into smaller steps and revisit after feedback. Investigations, review and quizzes have separate sessions. Study the four visual parts across the scheduled sessions, then use the illustrated worked case and independent transfer questions. Extend or revisit a session when the learner cannot explain the figure; completion time is a proposed allocation, not a mastery guarantee.
Start with something to explain
What would explain the observations in temperature & thermal energy?
Illustrative evidence case. Two supplied water samples at 25 °C have masses 100 g and 400 g. A second pair has equal mass but temperatures 25 and 40 °C.
Notice and wonder
Does four times the mass imply four times the temperature? Write two observations from the supplied record without guessing their cause. Include a quantity and its unit when given. An observation is what was recorded; an inference is what you think explains it.
Write one question about why the pattern occurs and one question about a comparison that could distinguish competing explanations. A testable question identifies what could be observed or measured.
Your first model
Before reading the model answer, sketch the named objects or particles and label what you think changes. Explain what temperature compares and why equal temperature alone does not imply equal internal energy. Predict the direction of net thermal transfer for the second pair in contact. Keep this first version so you can compare it with your later explanation.
Build the language from the idea
- temperature
- A measure related to average particle kinetic energy.
- heat
- Energy transferred because of a temperature difference.
- thermal equilibrium
- A state in which interacting objects have the same temperature.
- model
- A representation that explains selected features and makes predictions; it leaves other details out.
- evidence
- Relevant observations or records used to support or challenge a claim.
- system boundary
- The chosen limit separating the objects being studied from their surroundings.
- assumption
- A condition taken as true for a model or calculation and needing to be checked against the case.
Particles of matter are always moving. In a simple particle model, temperature relates to their average kinetic energy. A higher temperature means faster average particle motion for the same substance in the same phase. Temperature is an average; not every particle has the same speed.
Thermal energy depends on the amount of matter, its temperature, and the material. Two cups of water at 40°C have the same temperature as one cup at 40°C, but together they contain more thermal energy relative to the same reference state. You cannot rank the thermal energy of arbitrary objects using temperature alone.
When objects at different temperatures interact, energy transfers from the warmer object to the cooler one overall. This transfer is called heat. In an insulated system, transfer continues until the objects reach thermal equilibrium: the same temperature. Heat is energy being transferred, not a substance stored inside an object.
Temperature describes average particle kinetic energy in a simple model. Thermal energy depends on how many particles there are as well as their motion and interactions. A large warm bath can store more thermal energy than a tiny hotter droplet, even though its temperature is lower.
Heat is energy transferred because of a temperature difference. For objects in contact without an external energy supply, the warmer object transfers energy to the cooler one until thermal equilibrium is reached. The thermometer measures temperature; it does not directly measure all the stored energy.
Compare equal amounts of materials when investigating temperature change. Control starting temperature, heating time and energy input. Different materials can change temperature by different amounts under the same heating, so temperature change alone does not tell you that the energy inputs differed.
Build your understanding
Where this fits
This unit helps answer the chapter question: How can adding or removing energy change matter? Keep a notebook table with the question, evidence, explanation and one unresolved issue. Revise a previous model only when you can name the new evidence or idea that changes it.
Use three teaching sessions of about 40–45 minutes: first observe the phenomenon, draft a model and study Parts 1–2; next explain Parts 3–4 with the figures and evidence; then work the application, examples, practice, model revision and exit check. Divide any difficult part into smaller steps and revisit after feedback. Investigations, review and quizzes have separate sessions.
Part 1 · Compare averages with totals
Temperature relates to average particle kinetic energy in a simple introductory model. Thermal energy also depends on amount of matter, material, and particle interactions. Objects with the same temperature need not contain the same amount of thermal energy relative to a specified reference state.
Read the visual model
Why does twice as much water at 30°C not have a temperature of 60°C?
Visual reasoning — after your attempt
Temperature describes an average rather than a sum. Adding an equal amount at the same temperature increases the amount of matter, not its average particle kinetic energy.
Two identical cups of water at 30°C have the same temperature as one cup at 30°C. Together, the two cups contain more thermal energy relative to the same reference. Doubling water amount does not double its Celsius temperature.
Pause and explain
Why does twice as much water at 30°C not have a temperature of 60°C?
Check your reasoning after answering
Temperature describes an average rather than a sum. Adding an equal amount at the same temperature increases the amount of matter, not its average particle kinetic energy.
Part 2 · Separate stored energy from heat transfer
Heat is energy transferred because of a temperature difference. In ordinary passive contact, net transfer is from warmer to cooler matter. Calling heat a substance inside an object hides the distinction between an energy store and a transfer. Insulation slows transfer; it does not manufacture energy.
Read the visual model
Heat names energy transferred because of a temperature difference. Thermal energy names an energy contribution within an account. When temperatures match, the simple model has no net heat transfer between these two objects, though microscopic exchanges can still occur.
Would simply adding the initial temperatures give the equilibrium temperature? Explain what is held comparable here.
Visual reasoning — after your attempt
No. For this ideal equal-mass, same-substance case the result is the midpoint 50 °C, not 100 °C. Amount, substance, phase and outside transfers affect the prediction.
A warm cup cools while nearby cooler surroundings gain energy. Draw an arrow from the cup to the surroundings and label it energy transfer by heating. Do not draw cold flowing into the cup as though cold were a material.
Pause and explain
What changes when a warm cup is wrapped in insulation?
Check your reasoning after answering
Insulation reduces the rate of energy transfer to cooler surroundings. It does not necessarily change the starting temperature or create thermal energy.
Part 3 · Predict thermal equilibrium with assumptions
Objects in thermal contact can approach the same temperature. A final temperature depends on masses, materials, phase changes, and energy exchange with surroundings. An arithmetic mean works only for special cases, such as equal masses of the same liquid with negligible losses and no phase change.
Read the visual model
Would 30°C necessarily result from mixing any two objects at 20°C and 40°C?
Visual reasoning — after your attempt
No. Different amounts, heat capacities, phase changes, or energy exchange with the surroundings can produce a different final temperature.
Equal masses of water at 20°C and 40°C mix in an ideally insulated container to approach 30°C. More cold water would pull the final temperature closer to 20°C. The result is a prediction from a model, not a rule for all mixtures.
Pause and explain
Would 30°C necessarily result from mixing any two objects at 20°C and 40°C?
Check your reasoning after answering
No. Different amounts, heat capacities, phase changes, or energy exchange with the surroundings can produce a different final temperature.
Part 4 · Use a thermometer rather than touch alone
Touch senses energy transfer through skin and is not a reliable thermometer. Two surfaces at the same room temperature may feel different because they transfer energy at different rates. A fair measurement uses the same thermometer procedure and enough time for the sensor to respond.
Read the visual model
A thermometer’s reading is a measurement with a method and an uncertainty. Allow the sensor to settle, read the scale correctly and note conditions. Skin sensation alone cannot supply an exact temperature or safe handling decision.
Could two objects at the same room temperature feel different to the same hand? How would you test their temperatures?
Visual reasoning — after your attempt
Yes, their energy-transfer rates with skin can differ. Compare safe, suitable thermometer readings under comparable conditions rather than relying on how they feel.
Room-temperature metal may feel cooler than wood because it transfers energy away from warmer skin more rapidly. Check actual temperature before claiming the metal started colder. Compare readings, not just sensations.
Pause and explain
Why can equally warm wood and metal feel different?
Check your reasoning after answering
Their thermal transfer properties differ. Metal typically conducts energy away from the skin faster, so sensation does not directly establish a temperature difference.
Compare heating by mass and material
Equal energy inputs do not require equal temperature changes when the samples differ in amount or material.
Temperature describes a quantity related to average particle motion; thermal/internal energy also depends on amount, phase and interactions. Heat capacity describes how much energy input is needed for a stated temperature rise under specified conditions. We compare supplied temperature records here rather than calculate every sample’s total thermal energy. A smaller temperature rise can occur because energy is distributed through more material or because the material responds differently.
To isolate mass, use the same material at different masses, matched starting temperature, phase, container conditions and energy input. To isolate material type, match mass and the other conditions while comparing materials. A source that operates for equal time may not deliver equal energy if its power or contact changes. The environment and container can also receive energy, so an apparatus account should specify the measurement boundary.
Plan and interpret the observations: record starting/final temperatures and times with a suitable thermometer, identify sample amounts and material, and keep all trials. An investigation can compare warming or cooling under an approved safe method. At home, use room-temperature/cool-water comparisons or supplied data without heaters; some quantitative comparisons require controlled equipment. State whether an unexpected change could reflect a changed input, sample or exchange with surroundings.
Evidence to interpret
| Sample | Mass (g) | Starting temperature (°C) | Final temperature (°C) | Input |
|---|---|---|---|---|
| Water | 50 | 20 | 24 | Same modeled amount |
| Water | 100 | 20 | 22 | Same modeled amount |
| Model solid | 50 | 20 | 28 | Same modeled amount |
Investigate or evaluate the supplied records
- State the mass question or material question, not both together.
- Define starting temperature, phase, measuring interval and energy-input comparison.
- Use the supplied quantitative records or an approved supervised method; collect real readings only when the input can be justified.
- Compare temperature changes and graph the intended factor.
- Repeat, account for environment/container effects and evaluate a changed case.
Explain and apply
Design separate mass and material comparisons using the table. Explain the two trends and specify how a real investigation would verify matched energy input and limit environmental transfers.
- Choose separately controlled pairs.
- Explain amount/material response without equating heat with temperature.
- Specify input, tools, records and uncertainties.
Reasoning and marking guidance — after your attempt
50 versus 100 g water isolates mass in the supplied model and gives rises 4 versus 2 °C. The 50 g water versus 50 g model solid comparison isolates material and gives rises 4 versus 8 °C. Equal input does not impose equal temperature change. Verify input method, starting state, container and surroundings, repeat readings, and label the supplied values rather than claim actual collection.
Apply the whole unit · Explain a mixing prediction
Illustrative case: equal masses of liquid water at 20°C and 40°C are mixed. The prediction model assumes negligible heat loss, the same heat capacity, and no phase change. A measured final temperature is 28°C.
Your task
Predict the ideal final temperature, draw the direction of net energy transfer, and give two possible reasons for the measured difference. Explain why a larger amount of cold water would change the prediction.
What your response should show
- Use the supplied observations and measurements accurately; include units where needed.
- Explain the science behind your answer, rather than giving only a number or label.
- Show a labeled model, calculation, or evidence comparison as requested.
- State an assumption or limitation and suggest a useful next measurement.
Response guidance — after your attempt
The equal-mass ideal prediction is 30°C, with net transfer from warmer water to cooler water. A cooler container or surrounding heat loss could lower the measured value; thermometer error or unequal masses could also matter. More cold water increases its contribution and shifts the final temperature toward 20°C. Identify a measurement to distinguish these explanations.
Scientific references and adapted teaching resources
- OpenSciEd 6.2 Thermal Energy — public unit overview
- OpenSciEd instructional model — storyline routines
- Creative Commons Attribution 4.0 — middle-school material license
Parent / teacher teaching notes
Use colored mass counters rather than a formula for heat capacity at first. Ask the learner to explain why the arithmetic mean is conditional. Use supplied data or comfortably warm water; avoid hot-water handling. Adaptation credit: OpenSciEd middle-school teaching routines and public task structures by OpenSciEd, CC BY 4.0. This independent version adds original explanatory text, data and figures, terminology support and a home-study schedule. It does not reproduce the complete teacher editions or their classroom validation. The illustrated study “Compare heating by mass and material” is required curriculum content. Teach it before the associated application or distribute it over the assigned unit sessions; it is not an optional enrichment. Its practice/review/quiz response provides evidence of understanding. Model/data work must not be recorded as an actual physical experiment.
The key idea
Temperature describes an average; the total thermal energy also depends on how much material there is.
Worked examples
Example 1
- The temperatures match, so average particle kinetic energies are comparable.
- The larger sample contains more water particles.
Example 2 · Worked application
- Both thermometer readings are 35°C, so their temperatures match.
- The larger amount contains more water mass.
- For the same material and temperature rise, required energy increases with mass.
Keep temperature, material and temperature rise distinct from mass.
Example 3
- Equal masses of the same material exchange equal amounts of energy in this ideal model.
- The final temperature lies halfway between: (20+60)/2=40°C.
Example 4 · Find and fix the mistake
- Test the claim against the stated conditions: Keep temperature, material and temperature rise distinct from mass.
- Thermal energy also depends on amount and material. Temperature alone cannot rank total energy for unequal objects.
Keep temperature, material and temperature rise distinct from mass.
Example 5 · Interpret the visual model
- Identify the represented objects, axes, labeled quantities and stated conditions before choosing a rule.
- Heat names energy transferred because of a temperature difference. Thermal energy names an energy contribution within an account. When temperatures match, the simple model has no net heat transfer between these two objects, though microscopic exchanges can still occur.
- No. For this ideal equal-mass, same-substance case the result is the midpoint 50 °C, not 100 °C. Amount, substance, phase and outside transfers affect the prediction.
Keep the model’s stated limits explicit: The model compares equal masses of the same substance initially at 80 and 20 °C, with no phase changes or net exchange with other objects. Net energy transfer is from warmer to cooler, reaching 50 °C under the stated ideal assumptions. The red arrow shows energy transfer, not flow of a substance called heat or cold. Different masses or substances would require a different final-temperature account.
Avoid these mistakes
- Heat and temperature are related but are not the same quantity.
Check your understanding
Two equal-mass water samples at 20°C and 60°C mix in an insulated container. Estimate the final temperature.
Discuss the answer
About 40°C, assuming no heat loss, evaporation or container energy change.
Why does a larger cup of water at the same temperature require more energy to warm equally?
Discuss the answer
Temperature describes average particle kinetic energy in a simple model. Thermal energy depends on how many particles there are as well as their motion and interactions. A large warm bath can store more thermal energy than a tiny hotter droplet, even though its temperature is lower. Heat is energy transferred because of a temperature difference. For objects in contact without an external energy supply, the warmer object transfers energy to the cooler one until thermal equilibrium is reached. The thermometer measures temperature; it does not directly measure all the stored energy.
Return to the phenomenon
Two supplied water samples at 25 °C have masses 100 g and 400 g. A second pair has equal mass but temperatures 25 and 40 °C. Explain what temperature compares and why equal temperature alone does not imply equal internal energy. Predict the direction of net thermal transfer for the second pair in contact. Revise your first explanation using a named idea from the lesson. Mark the changed part and the evidence that supports it.
Compare explanations after your attempt
For the same substance, temperature is related to average particle motion, while internal energy also depends on amount and interactions. The larger 25 °C sample can have greater internal energy despite equal temperature. Net thermal transfer is from the 40 °C sample toward the 25 °C sample under contact conditions, not a flow of a material called cold.
What should we investigate next?
Which condition could be changed to test a remaining uncertainty in this explanation? State the predicted observation and what result would challenge your model.
Investigate, explain and revise
Use these tasks after the three teaching sessions as needed. Discuss an attempted explanation before opening response guidance; a matching sentence is less important than a supported mechanism.
Activity 1 · Explain the new evidence case
Use the visible scenario above, Parts 1–4 and your first notebook model. No outside reading or equipment is required.
Your task
Two supplied water samples at 25 °C have masses 100 g and 400 g. A second pair has equal mass but temperatures 25 and 40 °C. Explain what temperature compares and why equal temperature alone does not imply equal internal energy. Predict the direction of net thermal transfer for the second pair in contact. Write 100–150 words or give a labeled drawing with an equivalent oral explanation.
Success criteria
- Use two relevant stated records or conditions.
- Explain the mechanism rather than only repeat a definition.
- Label observation and inference.
- Name a changed model feature or a remaining uncertainty.
Hint
Read the stated boundary and conditions before selecting a relationship. The unit’s worked examples show intermediate steps.
Response guidance — discuss after your attempt
For the same substance, temperature is related to average particle motion, while internal energy also depends on amount and interactions. The larger 25 °C sample can have greater internal energy despite equal temperature. Net thermal transfer is from the 40 °C sample toward the 25 °C sample under contact conditions, not a flow of a material called cold.
Activity 2 · Read and extend the figure
Study the new labeled figure and its caption, then compare it with the associated teaching part.
Your task
Does four times the mass imply four times the temperature? Explain what each important label represents. Add one missing feature that would be needed for a different question, and explain why the original figure leaves it out.
Success criteria
- Answer the figure question with its stated labels.
- Connect the visual representation to the scientific idea.
- Identify a specific limitation from the caption.
- Propose a useful change without misrepresenting supplied evidence.
Hint
For the same substance at the same temperature and phase, average particle-motion conditions are comparable, but the amount differs. The boxes do not assign a numerical internal energy from temperature alone. More material can contain greater internal energy at the same temperature.
Response guidance — discuss after your attempt
No. Temperature is not total energy or amount. Both are 25 °C under the supplied conditions. For the same substance at the same temperature and phase, average particle-motion conditions are comparable, but the amount differs. The boxes do not assign a numerical internal energy from temperature alone. More material can contain greater internal energy at the same temperature.
Words to know
- temperature
- A measure related to average particle kinetic energy.
- heat
- Energy transferred because of a temperature difference.
- thermal equilibrium
- A state in which interacting objects have the same temperature.
- model
- A representation that explains selected features and makes predictions; it leaves other details out.
- evidence
- Relevant observations or records used to support or challenge a claim.
- system boundary
- The chosen limit separating the objects being studied from their surroundings.
- assumption
- A condition taken as true for a model or calculation and needing to be checked against the case.
In the real world
Exit check
Does four times the mass imply four times the temperature? Explain the relevant mechanism and one model limitation.
Check your explanation after answering
No. Temperature is not total energy or amount. Both are 25 °C under the supplied conditions. For the same substance at the same temperature and phase, average particle-motion conditions are comparable, but the amount differs. The boxes do not assign a numerical internal energy from temperature alone. More material can contain greater internal energy at the same temperature.
Explain your reasoning without notes. If a key idea is missing, revisit the lesson and try again.
Gas Particles, Diffusion & Pressure
Learning goals
- I can explain diffusion and gas pressure with particle motion and collisions.
- I can test a fixed-amount, matched-temperature pressure–volume model and identify its limits.
Readings for this unit
Before this unit
Review the earlier states/temperature particle models. The visible language notes explain this unit’s quantities; then connect them to its concrete records and figure.
Use three teaching sessions of about 40–45 minutes: first observe the phenomenon, draft a model and study Parts 1–2; next explain Parts 3–4 with the figures and evidence; then work the application, examples, practice, model revision and exit check. Divide any difficult part into smaller steps and revisit after feedback. Investigations, review and quizzes have separate sessions. Study the four visual parts across the scheduled sessions, then use the illustrated worked case and independent transfer questions. Extend or revisit a session when the learner cannot explain the figure; completion time is a proposed allocation, not a mastery guarantee.
Start with something to explain
What would explain the observations in gas particles, diffusion & pressure?
Illustrative evidence case. Illustrative constant-temperature records give 80 kPa at 60 mL and 120 kPa at 40 mL for one fixed gas sample.
Notice and wonder
What changes without changing particle identity? Write two observations from the supplied record without guessing their cause. Include a quantity and its unit when given. An observation is what was recorded; an inference is what you think explains it.
Write one question about why the pattern occurs and one question about a comparison that could distinguish competing explanations. A testable question identifies what could be observed or measured.
Your first model
Before reading the model answer, sketch the named objects or particles and label what you think changes. Explain the trend and test whether pressure × volume stays constant. Keep this first version so you can compare it with your later explanation.
Build the language from the idea
- diffusion
- Spreading caused by random particle motion.
- concentration
- Amount or number of particles per stated volume.
- gas pressure
- Force per unit area from gas impacts on a surface.
- compression
- Reduction of the space occupied by a material.
- absolute pressure
- Pressure measured relative to zero pressure, rather than only above local air pressure.
- model
- A representation that explains selected features and makes predictions; it leaves other details out.
- evidence
- Relevant observations or records used to support or challenge a claim.
- system boundary
- The chosen limit separating the objects being studied from their surroundings.
- assumption
- A condition taken as true for a model or calculation and needing to be checked against the case.
A closed bag can contain matter even when its contents cannot be seen. Air has mass and occupies space.
A gas consists of widely separated particles moving in many directions. A particle is a small constituent of matter; in air, many particles are molecules, which are groups of atoms held together.
The particles do not need a fan to begin moving. Random means their individual directions vary, not that their motion has no consequences.
Their collisions with walls produce a measurable push. We can use this model to explain spreading, squeezing and warming a gas without pretending to photograph its individual molecules.
An observation is what a person or instrument records. An inference is a proposed interpretation of those records. Keep the two separate: a graph can show a pattern while more than one mechanism might explain it. State the chosen system, or part of the world being studied, and its boundary before accounting for material or energy transfers.
Use each figure as a reasoning tool. Read its caption and labels, describe the pattern, then explain a cause. If the picture is schematic, use the stated numbers rather than measuring its printed size. Check whether its simplified conditions match the problem before applying a formula.
Build your understanding
Where this fits
This unit helps answer the chapter question: How can adding or removing energy change matter? Keep a notebook table with the question, evidence, explanation and one unresolved issue. Revise a previous model only when you can name the new evidence or idea that changes it.
Use three teaching sessions of about 40–45 minutes: first observe the phenomenon, draft a model and study Parts 1–2; next explain Parts 3–4 with the figures and evidence; then work the application, examples, practice, model revision and exit check. Divide any difficult part into smaller steps and revisit after feedback. Investigations, review and quizzes have separate sessions.
Part 1 · Explain spreading without a conveyor belt
Diffusion is the spreading and mixing produced by random particle motion. If particles are initially more concentrated in one region, more tend to leave that region than enter it until the concentration differences become smaller. Concentration here means the number of particles in a given volume.
Read the visual model
Diffusion is the spread of particles through their motion. The snapshots show distributions, not each particle’s exact path. Red is a tracking label for this model, not a literal color or proof of a chemical change.
Does more even spreading mean particles were created, or that every particle moved only to the right?
Visual reasoning — after your attempt
Neither. The four marked particles remain four. Individual motion can occur in many directions while the overall distribution becomes more even.
A drop of food coloring spreads through still room-temperature water. This is a liquid example of particle motion. Stirring also mixes water, but it adds large-scale fluid movement; a still-water observation should not automatically be explained as stirring.
Pause and explain
Does diffusion require every particle to move in the same direction?
Check your reasoning after answering
No. Individual particles move in varying directions. The overall distribution changes because more particles start in one region than another.
Part 2 · Connect collisions with pressure
Gas pressure is force per unit wall area resulting from many particle impacts. We cannot see an individual impact with our eyes, but a flexible wall can move as the collective push changes. Pressure is not a substance inside the bag.
Read the visual model
Pressure is force per area. Individual particles do not need to grow or stick to a wall to explain it. More frequent or stronger impacts can change the total force delivered per area over time.
Why can gas push on every wall rather than only the wall in the highlighted example?
Visual reasoning — after your attempt
Particles move in many directions and strike all walls. The highlighted collision explains a mechanism, not the only place where gas pressure acts.
Use an empty needle-free plastic syringe, if available, and cover its tip with a fingertip while pushing gently. The trapped air resists compression. Do not force the plunger or aim the tip at anyone. Supplied data give the same reasoning opportunity without this equipment.
Pause and explain
Why does trapped air resist being squeezed?
Check your reasoning after answering
The particles have less space and collide with the walls more frequently under comparable temperature conditions, increasing the pressure.
Part 3 · Change volume while keeping the comparison fair
Volume is the space occupied by the gas. In an approximately constant-temperature model with a fixed particle number, reducing volume increases pressure. The particles become closer together on average; each particle does not become smaller. A leak changes particle number and invalidates this particular comparison.
Read the visual model
A curve means the change is not a constant subtraction for each extra volume unit. Gas particles remain the same size; less volume changes collision opportunities. Use a supplied record instead of heating a sealed container.
Predict pressure at volume 3. Why would heating while compressing prevent a clean test of volume alone?
Visual reasoning — after your attempt
The model gives 120/3 = 40 kPa. Heating changes another influential variable, so the result would no longer isolate volume at fixed temperature.
Illustrative model values are 100 kPa at 40 mL and 200 kPa at 20 mL. The pressure is absolute pressure, measured relative to a vacuum, rather than only the extra pressure above room air. Use the stated numbers as a model, not a forecast for every syringe.
Pause and explain
What stayed fixed in this volume comparison?
Check your reasoning after answering
Particle number and temperature are assumed fixed. Volume changes, while particle size does not. A leaking syringe would not meet the fixed-particle assumption.
Part 4 · Distinguish a particle model from direct evidence
Warming a sealed rigid gas container increases average particle motion and can increase pressure. A diagram represents a proposed mechanism; measurements test the predicted relationship. The model needs a fixed amount of gas and a container that does not expand substantially.
Read the visual model
An observation is a record from a person or instrument. An inference interprets it. A model gains support when predictions fit several appropriate tests; a single gauge change does not reveal every microscopic detail.
Which entries are observations, and which are inferences? Suggest a useful next test.
Visual reasoning — after your attempt
Pressure readings and the measured smaller volume are observations. More frequent impacts and unchanged particle count are model claims supported by controlled conditions. Restore volume at fixed temperature and predict the pressure response.
Do not heat closed household containers. Instead compare supplied records of the same rigid vessel at two temperatures. Keep the vessel size and particle number explicit, and ask whether a different-size vessel would be a fair temperature test.
Pause and explain
Why not compare a warm large vessel with a cool small vessel to isolate temperature?
Check your reasoning after answering
Both temperature and volume change. Either can influence pressure, so the difference would not isolate temperature.
Apply the whole unit · A compressed gas
Illustrative case for analysis, not measurements collected by the learner. Illustrative constant-temperature records give 80 kPa at 60 mL and 120 kPa at 40 mL for one fixed gas sample.
Your task
Explain the trend and test whether pressure × volume stays constant. Use the supplied conditions, show intermediate reasoning and distinguish the supported conclusion from a broader claim.
What your response should show
- Use the specified quantities and units.
- Explain an intermediate step or comparison.
- Connect the pattern to the physical mechanism.
- State an assumption or limitation.
Response guidance — after your attempt
Compute the first pressure–volume product: 80×60=4,800 kPa·mL.
Compute the second: 120×40=4,800 kPa·mL, matching the model product.
Compare volume and pressure: decreasing volume at fixed temperature and particle number increases wall impacts; it does not shrink particles.
State that a leak or changing temperature would invalidate the intended comparison.
80×60=4,800 and 120×40=4,800 kPa·mL. The smaller volume gives greater pressure while the model product stays constant. The gas particles do not shrink; more frequent wall impacts explain the increased pressure. This evidence is conditional on fixed temperature and particle number.
Scientific references and adapted teaching resources
- OpenSciEd 6.2 Thermal Energy — public unit overview
- OpenSciEd instructional model — storyline routines
- Creative Commons Attribution 4.0 — middle-school material license
Parent / teacher teaching notes
Ask the learner to describe the phenomenon before naming a formula. Discuss each checkpoint after an attempt. Use the supplied records when equipment is unavailable and label them illustrative rather than actual measurements. The final explanation should identify a mechanism and a limit, with different defensible wording accepted. Adaptation credit: OpenSciEd middle-school teaching routines and public task structures by OpenSciEd, CC BY 4.0. This independent version adds original explanatory text, data and figures, terminology support and a home-study schedule. It does not reproduce the complete teacher editions or their classroom validation.
The key idea
The space between gas particles decreases; the individual molecules retain their sizes in this model. 80×60=4,800 and 120×40=4,800 kPa·mL.
Worked examples
Example 1 · Build the first reasoning step
- Identify what the question asks and what the stated observation establishes.
- No. Individual particles move in varying directions. The overall distribution changes because more particles start in one region than another.
Example 2 · A compressed gas
- Compute the first pressure–volume product: 80×60=4,800 kPa·mL.
- Compute the second: 120×40=4,800 kPa·mL, matching the model product.
- Compare volume and pressure: decreasing volume at fixed temperature and particle number increases wall impacts; it does not shrink particles.
- State that a leak or changing temperature would invalidate the intended comparison.
Explain why each stated condition matters.
Example 3 · Transfer to a different condition
- Identify the changed condition.
- No. Escaping gas changes particle number, so the fixed-amount assumption no longer applies. Account for matter crossing the boundary before testing that prediction.
Example 4 · Find and fix the mistake
- Distinguish what is observed from what is inferred.
- The space between gas particles decreases; the individual molecules retain their sizes in this model.
Compare the claim with the stated observations and model assumptions.
Example 5 · Interpret the visual model
- Identify the represented objects, axes, labeled quantities and stated conditions before choosing a rule.
- Diffusion is the spread of particles through their motion. The snapshots show distributions, not each particle’s exact path. Red is a tracking label for this model, not a literal color or proof of a chemical change.
- Neither. The four marked particles remain four. Individual motion can occur in many directions while the overall distribution becomes more even.
Keep the model’s stated limits explicit: Both closed-container snapshots contain twelve schematic background particles and four marked particles. The marked gas initially occupies a smaller region and is later more spread out. Particle identities and numbers remain fixed; individual motion and collisions, not a conveyor aimed toward empty space, produce spreading. Counts represent selected particles rather than an actual gas sample size.
Avoid these mistakes
- The space between gas particles decreases; the individual molecules retain their sizes in this model.
- Do not treat a schematic drawing as a scale measurement or a universal guarantee.
- Keep the stated comparison conditions and measurement boundary explicit.
- A correct numerical result needs units and an explanation of its meaning.
Check your understanding
Does diffusion require every particle to move in the same direction?
Discuss the answer
No. Individual particles move in varying directions. The overall distribution changes because more particles start in one region than another.
Why does trapped air resist being squeezed?
Discuss the answer
The particles have less space and collide with the walls more frequently under comparable temperature conditions, increasing the pressure.
What stayed fixed in this volume comparison?
Discuss the answer
Particle number and temperature are assumed fixed. Volume changes, while particle size does not. A leaking syringe would not meet the fixed-particle assumption.
Why not compare a warm large vessel with a cool small vessel to isolate temperature?
Discuss the answer
Both temperature and volume change. Either can influence pressure, so the difference would not isolate temperature.
Return to the phenomenon
Illustrative constant-temperature records give 80 kPa at 60 mL and 120 kPa at 40 mL for one fixed gas sample. Explain the trend and test whether pressure × volume stays constant. Revise your first explanation using a named idea from the lesson. Mark the changed part and the evidence that supports it.
Compare explanations after your attempt
80×60=4,800 and 120×40=4,800 kPa·mL. The smaller volume gives greater pressure while the model product stays constant. The gas particles do not shrink; more frequent wall impacts explain the increased pressure. This evidence is conditional on fixed temperature and particle number.
What should we investigate next?
Which condition could be changed to test a remaining uncertainty in this explanation? State the predicted observation and what result would challenge your model.
Investigate, explain and revise
Use these tasks after the three teaching sessions as needed. Discuss an attempted explanation before opening response guidance; a matching sentence is less important than a supported mechanism.
Activity 1 · Explain the new evidence case
Use the visible scenario above, Parts 1–4 and your first notebook model. No outside reading or equipment is required.
Your task
Illustrative constant-temperature records give 80 kPa at 60 mL and 120 kPa at 40 mL for one fixed gas sample. Explain the trend and test whether pressure × volume stays constant. Write 100–150 words or give a labeled drawing with an equivalent oral explanation.
Success criteria
- Use two relevant stated records or conditions.
- Explain the mechanism rather than only repeat a definition.
- Label observation and inference.
- Name a changed model feature or a remaining uncertainty.
Hint
Read the stated boundary and conditions before selecting a relationship. The unit’s worked examples show intermediate steps.
Response guidance — discuss after your attempt
80×60=4,800 and 120×40=4,800 kPa·mL. The smaller volume gives greater pressure while the model product stays constant. The gas particles do not shrink; more frequent wall impacts explain the increased pressure. This evidence is conditional on fixed temperature and particle number.
Activity 2 · Read and extend the figure
Study the new labeled figure and its caption, then compare it with the associated teaching part.
Your task
What changes without changing particle identity? Explain what each important label represents. Add one missing feature that would be needed for a different question, and explain why the original figure leaves it out.
Success criteria
- Answer the figure question with its stated labels.
- Connect the visual representation to the scientific idea.
- Identify a specific limitation from the caption.
- Propose a useful change without misrepresenting supplied evidence.
Hint
The dots stand for particles and are not to scale or literal colors. A fixed particle count is compressed into less space at matched temperature. More frequent wall impacts can increase gas pressure; the particles do not become smaller.
Response guidance — discuss after your attempt
Spacing, arrangement and allowed motion can change. In the gas compression model, volume changes while particle number and temperature are held fixed. The dots stand for particles and are not to scale or literal colors. A fixed particle count is compressed into less space at matched temperature. More frequent wall impacts can increase gas pressure; the particles do not become smaller.
Words to know
- diffusion
- Spreading caused by random particle motion.
- concentration
- Amount or number of particles per stated volume.
- gas pressure
- Force per unit area from gas impacts on a surface.
- compression
- Reduction of the space occupied by a material.
- absolute pressure
- Pressure measured relative to zero pressure, rather than only above local air pressure.
- model
- A representation that explains selected features and makes predictions; it leaves other details out.
- evidence
- Relevant observations or records used to support or challenge a claim.
- system boundary
- The chosen limit separating the objects being studied from their surroundings.
- assumption
- A condition taken as true for a model or calculation and needing to be checked against the case.
In the real world
Illustrative constant-temperature records give 80 kPa at 60 mL and 120 kPa at 40 mL for one fixed gas sample.
Exit check
What changes without changing particle identity? Explain the relevant mechanism and one model limitation.
Check your explanation after answering
Spacing, arrangement and allowed motion can change. In the gas compression model, volume changes while particle number and temperature are held fixed. The dots stand for particles and are not to scale or literal colors. A fixed particle count is compressed into less space at matched temperature. More frequent wall impacts can increase gas pressure; the particles do not become smaller.
Explain your reasoning without notes. If a key idea is missing, revisit the lesson and try again.
Evaporation, Condensation & a Wet Cold Cup
Learning goals
- I can account for water during evaporation and condensation using a boundary and a particle model.
- I can use a supplied dew point and plan a comparison that separates influential conditions.
Readings for this unit
Before this unit
Review the earlier states and temperature units. The visible language notes explain this unit’s quantities; then connect them to its concrete records and figure.
Use three teaching sessions of about 40–45 minutes: first observe the phenomenon, draft a model and study Parts 1–2; next explain Parts 3–4 with the figures and evidence; then work the application, examples, practice, model revision and exit check. Divide any difficult part into smaller steps and revisit after feedback. Investigations, review and quizzes have separate sessions. Study the four visual parts across the scheduled sessions, then use the illustrated worked case and independent transfer questions. Extend or revisit a session when the learner cannot explain the figure; completion time is a proposed allocation, not a mastery guarantee.
Start with something to explain
What would explain the observations in evaporation, condensation & a wet cold cup?
Illustrative evidence case. Illustrative records show a cold intact cup with clear outside droplets. An open tray loses 6 g while a covered matched tray loses 1 g in an hour.
Notice and wonder
What energy pathway should a fuller model add? Write two observations from the supplied record without guessing their cause. Include a quantity and its unit when given. An observation is what was recorded; an inference is what you think explains it.
Write one question about why the pattern occurs and one question about a comparison that could distinguish competing explanations. A testable question identifies what could be observed or measured.
Your first model
Before reading the model answer, sketch the named objects or particles and label what you think changes. Explain both observations and identify a limit of the mass comparison. Keep this first version so you can compare it with your later explanation.
Build the language from the idea
- evaporation
- Liquid changing to gas at its surface.
- condensation
- Gas changing to liquid.
- water vapor
- Water in the normally invisible gas phase.
- humidity
- Water vapor content of air, expressed with a specified measure.
- dew point
- Temperature at which cooling air reaches saturation under the specified conditions.
- model
- A representation that explains selected features and makes predictions; it leaves other details out.
- evidence
- Relevant observations or records used to support or challenge a claim.
- system boundary
- The chosen limit separating the objects being studied from their surroundings.
- assumption
- A condition taken as true for a model or calculation and needing to be checked against the case.
A dry cold cup can acquire droplets on its outside while a puddle elsewhere dries. Water has not been created in one place and destroyed in the other.
Evaporation means liquid water changes to gas at its surface; condensation means gaseous water changes to liquid. Water vapor is the gas form and is normally invisible.
Visible fog is mainly tiny liquid droplets suspended in air. Begin by drawing separate boundaries around the cup contents, the cup surface and the surrounding air.
This prevents the common mistake of assuming that outside droplets must have leaked through the cup wall.
An observation is what a person or instrument records. An inference is a proposed interpretation of those records. Keep the two separate: a graph can show a pattern while more than one mechanism might explain it. State the chosen system, or part of the world being studied, and its boundary before accounting for material or energy transfers.
Use each figure as a reasoning tool. Read its caption and labels, describe the pattern, then explain a cause. If the picture is schematic, use the stated numbers rather than measuring its printed size. Check whether its simplified conditions match the problem before applying a formula.
Build your understanding
Where this fits
This unit helps answer the chapter question: How can adding or removing energy change matter? Keep a notebook table with the question, evidence, explanation and one unresolved issue. Revise a previous model only when you can name the new evidence or idea that changes it.
Use three teaching sessions of about 40–45 minutes: first observe the phenomenon, draft a model and study Parts 1–2; next explain Parts 3–4 with the figures and evidence; then work the application, examples, practice, model revision and exit check. Divide any difficult part into smaller steps and revisit after feedback. Investigations, review and quizzes have separate sessions.
Part 1 · Use a boundary to ask where water came from
A system is the part of the world chosen for analysis; its boundary separates it from the surroundings. A cup containing colored water can help distinguish inside water from water already present as vapor in the surrounding air. The color is evidence about origin, not a complete molecular photograph.
Read the visual model
Why compare with a room-temperature cup?
Visual reasoning — after your attempt
It helps test the role of cooling while keeping the cup construction similar. Clear outside water on the cold cup supports an air-water source rather than a colored leak.
Illustrative observations show blue water inside a sound cup but clear droplets outside after cooling. A room-temperature identical cup stays dry. These observations favor condensation from the air over a colored-water leak, though checking the cup for cracks remains sensible.
Pause and explain
Why compare with a room-temperature cup?
Check your reasoning after answering
It helps test the role of cooling while keeping the cup construction similar. Clear outside water on the cold cup supports an air-water source rather than a colored leak.
Part 2 · Explain evaporation below boiling
Liquid particles have a range of motion energies. Some at the surface can escape into the gas phase even while the liquid is well below its boiling temperature. Boiling produces vapor bubbles throughout liquid under suitable pressure; evaporation occurs at the surface and does not require visible bubbles.
Read the visual model
A surface is the boundary between liquid and its surroundings. Molecules in a liquid have a range of motions; an escaping molecule retains its chemical identity. Matter leaving also carries energy, linking evaporation to cooling.
Why can a puddle dry at room temperature without the whole puddle boiling?
Visual reasoning — after your attempt
Some surface particles can escape into the gas phase under those conditions. Boiling is a different bulk process involving vapor bubbles throughout the liquid.
A shallow wet tray can lose mass at room temperature. Covering it limits exchange with room air and permits vapor to return. The escaped water remains matter in the surroundings; a reduced reading for the tray is not destruction of water.
Pause and explain
Does a drying cloth need to reach 100 °C?
Check your reasoning after answering
No. Surface evaporation occurs below boiling. Water transfers from the cloth into the air, rather than vanish.
Part 3 · Explain condensation through energy transfer
When vapor contacts a sufficiently cool surface, energy transfer can favor liquid droplets. Humidity describes the water vapor in air; relative humidity compares the amount present with the saturation amount at that temperature. The dew point is the temperature at which air reaches saturation on cooling under the specified conditions.
Read the visual model
Condensation is a gas-to-liquid phase change. Keep chemical identity, water origin and energy transfer as separate questions. The container wall can be dry initially yet gain outside water without leaking from its interior.
Where do the droplets’ water and the transferred energy come from in this model?
Visual reasoning — after your attempt
The water comes from vapor in surrounding air. During condensation, energy transfers from the vapor/surrounding system toward the cooler wall; no new water is created.
If a supplied room dew point is 12 °C, a cup surface at 8 °C can collect condensation while one at 18 °C may remain dry. You do not need to calculate dew point here. Use the supplied value and distinguish surface temperature from the water temperature inside.
Evaporation and condensation can both occur at the same room temperature: particles leave a liquid surface while vapor particles can return. The net direction depends on the surroundings, vapor content and exchange conditions. There is no single universal evaporation temperature equivalent to a pure substance’s ordinary-pressure boiling point. Melting/freezing comparisons also need matching pressure and composition. This resolves the district map’s shared-temperature question without teaching that every evaporation and condensation event occurs at one fixed temperature.
Pause and explain
Which supplied cup is more likely to condense water?
Check your reasoning after answering
The 8 °C surface is below the supplied 12 °C dew point; the 18 °C surface is above it. The prediction depends on those air conditions.
Part 4 · Plan a comparison and account for energy
Air movement, exposed area and humidity can all affect evaporation. To investigate area, use equal water masses at the same starting temperature in two clean shallow vessels with different exposed areas, kept in comparable locations. Record mass changes without tasting any experimental water.
Read the visual model
Separate the outcomes: temperature measures thermal conditions and a balance measures matter remaining. A lid can affect several pathways, so use the results to evaluate the proposed mechanism rather than calling every difference proof.
At 30 minutes, how much cooler is the uncovered sample? What additional measurement tests evaporation directly?
Visual reasoning — after your attempt
It is 19.2−15 = 4.2 °C cooler. Measuring comparable mass loss tests whether more matter left the uncovered sample, while still considering other energy pathways.
Evaporation can cool the remaining liquid because escaping particles remove energy. Water and energy accounts therefore need separate arrows: a water arrow indicates where matter moves; an energy arrow shows a transfer, not a stream of a material called heat.
Pause and explain
Why is greater loss from a sunny wide tray not proof of an area effect alone?
Check your reasoning after answering
Area, illumination and possibly temperature differ. A comparison changing only intended area is needed to isolate its effect.
Apply the whole unit · Droplets and missing water
Illustrative case for analysis, not measurements collected by the learner. Illustrative records show a cold intact cup with clear outside droplets. An open tray loses 6 g while a covered matched tray loses 1 g in an hour.
Your task
Explain both observations and identify a limit of the mass comparison. Use the supplied conditions, show intermediate reasoning and distinguish the supported conclusion from a broader claim.
What your response should show
- Use the specified quantities and units.
- Explain an intermediate step or comparison.
- Connect the pattern to the physical mechanism.
- State an assumption or limitation.
Response guidance — after your attempt
Identify two matter boundaries: inside/outside the cold cup, and the water tray/room air.
Clear outside droplets on the intact cup can come from air vapor, while the tray can lose water by surface evaporation.
Subtract the tray losses: 6−1=5 g greater loss from the open tray in the stated hour.
Covering changes exchange and may change other conditions, so the comparison does not isolate every mechanism or imply water creation.
The droplets can be condensed water from surrounding air; the tray loss can be water evaporating into that air. The open tray loses 5 g more under the stated comparison. Covering changes exchange and can also change temperature or airflow, so the result does not isolate every mechanism. Neither observation requires water creation or destruction.
Scientific references and adapted teaching resources
- OpenSciEd 6.2 Thermal Energy — public unit overview
- OpenSciEd instructional model — storyline routines
- Creative Commons Attribution 4.0 — middle-school material license
Parent / teacher teaching notes
Ask the learner to describe the phenomenon before naming a formula. Discuss each checkpoint after an attempt. Use the supplied records when equipment is unavailable and label them illustrative rather than actual measurements. The final explanation should identify a mechanism and a limit, with different defensible wording accepted. Adaptation credit: OpenSciEd middle-school teaching routines and public task structures by OpenSciEd, CC BY 4.0. This independent version adds original explanatory text, data and figures, terminology support and a home-study schedule. It does not reproduce the complete teacher editions or their classroom validation.
The key idea
Existing water vapor from the air can condense on the cold surface; identify its source and energy transfer. The droplets can be condensed water from surrounding air; the tray loss can be water evaporating into that air.
Worked examples
Example 1 · Build the first reasoning step
- Identify what the question asks and what the stated observation establishes.
- It helps test the role of cooling while keeping the cup construction similar. Clear outside water on the cold cup supports an air-water source rather than a colored leak.
Example 2 · Droplets and missing water
- Identify two matter boundaries: inside/outside the cold cup, and the water tray/room air.
- Clear outside droplets on the intact cup can come from air vapor, while the tray can lose water by surface evaporation.
- Subtract the tray losses: 6−1=5 g greater loss from the open tray in the stated hour.
- Covering changes exchange and may change other conditions, so the comparison does not isolate every mechanism or imply water creation.
Explain why each stated condition matters.
Example 3 · Transfer to a different condition
- Identify the changed condition.
- The gas water vapor itself is normally invisible. The visible white cloud mainly consists of small condensed liquid droplets, and its appearance alone does not identify every particle present.
Example 4 · Find and fix the mistake
- Distinguish what is observed from what is inferred.
- Existing water vapor from the air can condense on the cold surface; identify its source and energy transfer.
Compare the claim with the stated observations and model assumptions.
Example 5 · Interpret the visual model
- Identify the represented objects, axes, labeled quantities and stated conditions before choosing a rule.
- A surface is the boundary between liquid and its surroundings. Molecules in a liquid have a range of motions; an escaping molecule retains its chemical identity. Matter leaving also carries energy, linking evaporation to cooling.
- Some surface particles can escape into the gas phase under those conditions. Boiling is a different bulk process involving vapor bubbles throughout the liquid.
Keep the model’s stated limits explicit: Selected particles leave the surface while the remaining liquid still contains interacting particles. Evaporation can occur below the boiling temperature and often removes particles with above-average kinetic energy, lowering the remaining average. This is a schematic selected-particle view, not a universal rule that every particle moves upward or that molecules break into new atoms.
Avoid these mistakes
- Existing water vapor from the air can condense on the cold surface; identify its source and energy transfer.
- Do not treat a schematic drawing as a scale measurement or a universal guarantee.
- Keep the stated comparison conditions and measurement boundary explicit.
- A correct numerical result needs units and an explanation of its meaning.
Check your understanding
Why compare with a room-temperature cup?
Discuss the answer
It helps test the role of cooling while keeping the cup construction similar. Clear outside water on the cold cup supports an air-water source rather than a colored leak.
Does a drying cloth need to reach 100 °C?
Discuss the answer
No. Surface evaporation occurs below boiling. Water transfers from the cloth into the air, rather than vanish.
Which supplied cup is more likely to condense water?
Discuss the answer
The 8 °C surface is below the supplied 12 °C dew point; the 18 °C surface is above it. The prediction depends on those air conditions.
Why is greater loss from a sunny wide tray not proof of an area effect alone?
Discuss the answer
Area, illumination and possibly temperature differ. A comparison changing only intended area is needed to isolate its effect.
Return to the phenomenon
Illustrative records show a cold intact cup with clear outside droplets. An open tray loses 6 g while a covered matched tray loses 1 g in an hour. Explain both observations and identify a limit of the mass comparison. Revise your first explanation using a named idea from the lesson. Mark the changed part and the evidence that supports it.
Compare explanations after your attempt
The droplets can be condensed water from surrounding air; the tray loss can be water evaporating into that air. The open tray loses 5 g more under the stated comparison. Covering changes exchange and can also change temperature or airflow, so the result does not isolate every mechanism. Neither observation requires water creation or destruction.
What should we investigate next?
Which condition could be changed to test a remaining uncertainty in this explanation? State the predicted observation and what result would challenge your model.
Investigate, explain and revise
Use these tasks after the three teaching sessions as needed. Discuss an attempted explanation before opening response guidance; a matching sentence is less important than a supported mechanism.
Activity 1 · Explain the new evidence case
Use the visible scenario above, Parts 1–4 and your first notebook model. No outside reading or equipment is required.
Your task
Illustrative records show a cold intact cup with clear outside droplets. An open tray loses 6 g while a covered matched tray loses 1 g in an hour. Explain both observations and identify a limit of the mass comparison. Write 100–150 words or give a labeled drawing with an equivalent oral explanation.
Success criteria
- Use two relevant stated records or conditions.
- Explain the mechanism rather than only repeat a definition.
- Label observation and inference.
- Name a changed model feature or a remaining uncertainty.
Hint
Read the stated boundary and conditions before selecting a relationship. The unit’s worked examples show intermediate steps.
Response guidance — discuss after your attempt
The droplets can be condensed water from surrounding air; the tray loss can be water evaporating into that air. The open tray loses 5 g more under the stated comparison. Covering changes exchange and can also change temperature or airflow, so the result does not isolate every mechanism. Neither observation requires water creation or destruction.
Activity 2 · Read and extend the figure
Study the new labeled figure and its caption, then compare it with the associated teaching part.
Your task
What energy pathway should a fuller model add? Explain what each important label represents. Add one missing feature that would be needed for a different question, and explain why the original figure leaves it out.
Success criteria
- Answer the figure question with its stated labels.
- Connect the visual representation to the scientific idea.
- Identify a specific limitation from the caption.
- Propose a useful change without misrepresenting supplied evidence.
Hint
Arrows indicate water from surrounding air reaching the cool outside surface. Blue liquid inside and clear droplets outside help compare possible sources. The drawing omits most air particles and energy pathways; it does not mean water vapor is itself visibly blue or that a cup makes new water.
Response guidance — discuss after your attempt
Energy transfers between the warmer air/vapor and cool surface as conditions favor condensation. Water and energy require distinct accounts. Arrows indicate water from surrounding air reaching the cool outside surface. Blue liquid inside and clear droplets outside help compare possible sources. The drawing omits most air particles and energy pathways; it does not mean water vapor is itself visibly blue or that a cup makes new water.
Words to know
- evaporation
- Liquid changing to gas at its surface.
- condensation
- Gas changing to liquid.
- water vapor
- Water in the normally invisible gas phase.
- humidity
- Water vapor content of air, expressed with a specified measure.
- dew point
- Temperature at which cooling air reaches saturation under the specified conditions.
- model
- A representation that explains selected features and makes predictions; it leaves other details out.
- evidence
- Relevant observations or records used to support or challenge a claim.
- system boundary
- The chosen limit separating the objects being studied from their surroundings.
- assumption
- A condition taken as true for a model or calculation and needing to be checked against the case.
In the real world
Illustrative records show a cold intact cup with clear outside droplets. An open tray loses 6 g while a covered matched tray loses 1 g in an hour.
Exit check
What energy pathway should a fuller model add? Explain the relevant mechanism and one model limitation.
Check your explanation after answering
Energy transfers between the warmer air/vapor and cool surface as conditions favor condensation. Water and energy require distinct accounts. Arrows indicate water from surrounding air reaching the cool outside surface. Blue liquid inside and clear droplets outside help compare possible sources. The drawing omits most air particles and energy pathways; it does not mean water vapor is itself visibly blue or that a cup makes new water.
Explain your reasoning without notes. If a key idea is missing, revisit the lesson and try again.
Heating Curves & Energy During Phase Change
Learning goals
- I can interpret a heating graph’s axes, rising intervals and phase-change plateau.
- I can account for energy input during melting and distinguish temperature from a complete energy account.
Readings for this unit
Before this unit
Review the earlier states, temperature and energy-transfer units. The visible language notes explain this unit’s quantities; then connect them to its concrete records and figure.
Use three teaching sessions of about 40–45 minutes: first observe the phenomenon, draft a model and study Parts 1–2; next explain Parts 3–4 with the figures and evidence; then work the application, examples, practice, model revision and exit check. Divide any difficult part into smaller steps and revisit after feedback. Investigations, review and quizzes have separate sessions. Study the four visual parts across the scheduled sessions, then use the illustrated worked case and independent transfer questions. Extend or revisit a session when the learner cannot explain the figure; completion time is a proposed allocation, not a mastery guarantee.
Start with something to explain
What would explain the observations in heating curves & energy during phase change?
Illustrative evidence case. Illustrative ice–water data remain near 0 °C for four minutes while a heater supplies 100 J each minute.
Notice and wonder
What changes during the level interval? Write two observations from the supplied record without guessing their cause. Include a quantity and its unit when given. An observation is what was recorded; an inference is what you think explains it.
Write one question about why the pattern occurs and one question about a comparison that could distinguish competing explanations. A testable question identifies what could be observed or measured.
Your first model
Before reading the model answer, sketch the named objects or particles and label what you think changes. Account for the 400 J input during the plateau and state an assumption. Keep this first version so you can compare it with your later explanation.
Build the language from the idea
- heating curve
- Graph of temperature during energy input.
- phase
- A physical state or distinct material region, such as solid or liquid.
- plateau
- Approximately level portion of a graph.
- latent heat
- Energy per amount of substance associated with a phase change at nearly steady temperature.
- coexistence
- Presence of two phases together under the stated conditions.
- model
- A representation that explains selected features and makes predictions; it leaves other details out.
- evidence
- Relevant observations or records used to support or challenge a claim.
- system boundary
- The chosen limit separating the objects being studied from their surroundings.
- assumption
- A condition taken as true for a model or calculation and needing to be checked against the case.
A thermometer can stop rising while ice melts even though energy continues to enter. Temperature describes a quantity related to average particle motion, whereas an energy transfer can also change the arrangement and interactions of particles.
A heating curve is a graph of temperature during energy input. A phase is a physical state such as solid or liquid.
A plateau is a nearly level section of a graph. These words name patterns we can observe; they do not replace the explanation.
Use supplied data for melting rather than an unsupervised boiling experiment.
An observation is what a person or instrument records. An inference is a proposed interpretation of those records. Keep the two separate: a graph can show a pattern while more than one mechanism might explain it. State the chosen system, or part of the world being studied, and its boundary before accounting for material or energy transfers.
Use each figure as a reasoning tool. Read its caption and labels, describe the pattern, then explain a cause. If the picture is schematic, use the stated numbers rather than measuring its printed size. Check whether its simplified conditions match the problem before applying a formula.
Build your understanding
Where this fits
This unit helps answer the chapter question: How can adding or removing energy change matter? Keep a notebook table with the question, evidence, explanation and one unresolved issue. Revise a previous model only when you can name the new evidence or idea that changes it.
Use three teaching sessions of about 40–45 minutes: first observe the phenomenon, draft a model and study Parts 1–2; next explain Parts 3–4 with the figures and evidence; then work the application, examples, practice, model revision and exit check. Divide any difficult part into smaller steps and revisit after feedback. Investigations, review and quizzes have separate sessions.
Part 1 · Read the axes before explaining the curve
A temperature–time graph puts elapsed time on the horizontal axis and temperature on the vertical axis. If a heater transfers energy at an approximately constant rate, later times correspond to greater supplied energy. Time is not itself energy, and changing heater power would change that connection.
Read the visual model
What does the graph directly record?
Visual reasoning — after your attempt
Temperature at recorded times. A constant-rate assumption connects time with energy input; the graph does not directly measure every energy pathway.
Illustrative pure-water readings at 0, 2, 4, 6, 8 and 10 minutes are −10, 0, 0, 0, 10 and 20 °C at ordinary pressure. Join neighboring points to represent the supplied trend; do not treat straight segments as measurements between all recorded times.
Pause and explain
What does the graph directly record?
Check your reasoning after answering
Temperature at recorded times. A constant-rate assumption connects time with energy input; the graph does not directly measure every energy pathway.
Part 2 · Explain warming within one phase
Within a single phase, energy transfer can increase average particle motion and thus temperature. Particles in ice already move by vibrating about positions. They do not remain perfectly motionless until melting begins. In liquid water they move while remaining relatively close together.
Read the visual model
Within a phase, a rising temperature can track increasing average particle kinetic energy. During a phase change, energy can change the arrangement instead; that requires a different model and a different reading of the curve.
What should change and what should stay the same in a particle drawing of this same-phase warming?
Visual reasoning — after your attempt
Motion patterns/average kinetic energy can change, while particle identity, count and size stay the same. This comparison is not a phase-change plateau.
From −10 to 0 °C, the modeled ice warms. After melting is complete, the modeled liquid warms from 0 to 20 °C. Both intervals show temperature change, but the particle arrangements differ.
Pause and explain
Were ice particles motionless at −10 °C?
Check your reasoning after answering
No. They vibrate in the solid. Warming changes their motion; melting later changes the larger arrangement and freedom to move.
Part 3 · Account for input during a plateau
During melting at the modeled pressure, energy supports changes in particle arrangement and interactions while solid and liquid coexist. The approximately steady temperature does not mean energy input stops. Latent heat is the energy per amount of substance associated with a phase change without the corresponding temperature rise.
Read the visual model
A plateau names a graph pattern, not an absence of change. Use both the temperature record and the phase model. The two panels simplify a gradual change in solid and liquid fractions and do not depict motionless solid particles.
Does a level temperature line during melting mean no energy enters, no particles move, or no change occurs?
Visual reasoning — after your attempt
None of those conclusions follows. Energy can keep entering while more of the sample becomes liquid; particle motion continues and the arrangement/phase proportions change.
Between 2 and 6 minutes, the illustrative curve stays near 0 °C. A drawing should show increasing liquid fraction, not larger water molecules. The model concerns a pure substance under stated conditions; mixtures can melt across a range.
Pause and explain
What evidence would show change despite constant temperature?
Check your reasoning after answering
A decreasing solid fraction and increasing liquid fraction while energy is supplied. Temperature alone is insufficient to describe the complete state.
Part 4 · Distinguish a model plateau from a universal temperature
Melting and boiling temperatures depend on substance and pressure; impurities can alter phase behavior. Cooling can remove energy while a substance freezes near its melting temperature under matching conditions. The direction of transfer determines which change proceeds.
Read the visual model
First identify the substance and conditions attached to each curve. A graph shape can support a phase-change interpretation, but the numerical temperature belongs to that particular material and pressure, not to the word melting.
What can the two plateau temperatures suggest, and what can they not establish alone?
Visual reasoning — after your attempt
They can distinguish behavior under matched known conditions. They cannot uniquely identify a substance or establish that every sample must melt at 0 °C; composition, pressure and other characteristic properties matter.
Use 0 °C for pure water melting in this simplified ordinary-pressure model, not every substance. A plateau at another temperature could belong to another material. No visible plateau in a brief household observation does not by itself invalidate the particle model.
Pause and explain
Can a temperature of 0 °C alone tell us the fraction of liquid water?
Check your reasoning after answering
No. Pure ice, a solid–liquid mixture or liquid at that temperature may be possible under the stated conditions; additional state evidence is needed.
Apply the whole unit · A heater that seems to stop warming
Illustrative case for analysis, not measurements collected by the learner. Illustrative ice–water data remain near 0 °C for four minutes while a heater supplies 100 J each minute.
Your task
Account for the 400 J input during the plateau and state an assumption. Use the supplied conditions, show intermediate reasoning and distinguish the supported conclusion from a broader claim.
What your response should show
- Use the specified quantities and units.
- Explain an intermediate step or comparison.
- Connect the pattern to the physical mechanism.
- State an assumption or limitation.
Response guidance — after your attempt
Identify a continuing input of 100 J each minute, not a stopped heater.
Multiply 100 J/min × 4 min = 400 J.
Explain the nearly steady temperature using changing phase fraction and particle interactions during melting.
Add possible container warming and surrounding transfers before assigning all real input to the water alone.
400 J enters during the four-minute interval. In the simplified model it supports melting and changed particle interactions while the temperature stays approximately constant. It is not missing energy. Some real input can also reach the container or surroundings, so attributing all 400 J to the sample requires an idealized boundary and negligible losses.
Scientific references and adapted teaching resources
- OpenSciEd 6.2 Thermal Energy — public unit overview
- OpenSciEd instructional model — storyline routines
- Creative Commons Attribution 4.0 — middle-school material license
Parent / teacher teaching notes
Ask the learner to describe the phenomenon before naming a formula. Discuss each checkpoint after an attempt. Use the supplied records when equipment is unavailable and label them illustrative rather than actual measurements. The final explanation should identify a mechanism and a limit, with different defensible wording accepted. Adaptation credit: OpenSciEd middle-school teaching routines and public task structures by OpenSciEd, CC BY 4.0. This independent version adds original explanatory text, data and figures, terminology support and a home-study schedule. It does not reproduce the complete teacher editions or their classroom validation.
The key idea
Continued input can change phase fraction and particle interactions while temperature remains nearly steady. 400 J enters during the four-minute interval.
Worked examples
Example 1 · Build the first reasoning step
- Identify what the question asks and what the stated observation establishes.
- Temperature at recorded times. A constant-rate assumption connects time with energy input; the graph does not directly measure every energy pathway.
Example 2 · A heater that seems to stop warming
- Identify a continuing input of 100 J each minute, not a stopped heater.
- Multiply 100 J/min × 4 min = 400 J.
- Explain the nearly steady temperature using changing phase fraction and particle interactions during melting.
- Add possible container warming and surrounding transfers before assigning all real input to the water alone.
Explain why each stated condition matters.
Example 3 · Transfer to a different condition
- Identify the changed condition.
- No. Temperature is not a complete measure of internal energy or phase fraction. Different arrangements and energy transfers can accompany the same temperature.
Example 4 · Find and fix the mistake
- Distinguish what is observed from what is inferred.
- Continued input can change phase fraction and particle interactions while temperature remains nearly steady.
Compare the claim with the stated observations and model assumptions.
Example 5 · Interpret the visual model
- Identify the represented objects, axes, labeled quantities and stated conditions before choosing a rule.
- Within a phase, a rising temperature can track increasing average particle kinetic energy. During a phase change, energy can change the arrangement instead; that requires a different model and a different reading of the curve.
- Motion patterns/average kinetic energy can change, while particle identity, count and size stay the same. This comparison is not a phase-change plateau.
Keep the model’s stated limits explicit: Both panels represent the same number and kind of particles in one phase. The warmer panel uses longer motion arrows to show a higher average kinetic energy in this introductory model. The arrows are not forces and the circles do not expand. Actual particle motions vary; equal arrow styles are a drawing simplification rather than a claim that all particles share one speed.
Avoid these mistakes
- Continued input can change phase fraction and particle interactions while temperature remains nearly steady.
- Do not treat a schematic drawing as a scale measurement or a universal guarantee.
- Keep the stated comparison conditions and measurement boundary explicit.
- A correct numerical result needs units and an explanation of its meaning.
Check your understanding
What does the graph directly record?
Discuss the answer
Temperature at recorded times. A constant-rate assumption connects time with energy input; the graph does not directly measure every energy pathway.
Were ice particles motionless at −10 °C?
Discuss the answer
No. They vibrate in the solid. Warming changes their motion; melting later changes the larger arrangement and freedom to move.
What evidence would show change despite constant temperature?
Discuss the answer
A decreasing solid fraction and increasing liquid fraction while energy is supplied. Temperature alone is insufficient to describe the complete state.
Can a temperature of 0 °C alone tell us the fraction of liquid water?
Discuss the answer
No. Pure ice, a solid–liquid mixture or liquid at that temperature may be possible under the stated conditions; additional state evidence is needed.
Return to the phenomenon
Illustrative ice–water data remain near 0 °C for four minutes while a heater supplies 100 J each minute. Account for the 400 J input during the plateau and state an assumption. Revise your first explanation using a named idea from the lesson. Mark the changed part and the evidence that supports it.
Compare explanations after your attempt
400 J enters during the four-minute interval. In the simplified model it supports melting and changed particle interactions while the temperature stays approximately constant. It is not missing energy. Some real input can also reach the container or surroundings, so attributing all 400 J to the sample requires an idealized boundary and negligible losses.
What should we investigate next?
Which condition could be changed to test a remaining uncertainty in this explanation? State the predicted observation and what result would challenge your model.
Investigate, explain and revise
Use these tasks after the three teaching sessions as needed. Discuss an attempted explanation before opening response guidance; a matching sentence is less important than a supported mechanism.
Activity 1 · Explain the new evidence case
Use the visible scenario above, Parts 1–4 and your first notebook model. No outside reading or equipment is required.
Your task
Illustrative ice–water data remain near 0 °C for four minutes while a heater supplies 100 J each minute. Account for the 400 J input during the plateau and state an assumption. Write 100–150 words or give a labeled drawing with an equivalent oral explanation.
Success criteria
- Use two relevant stated records or conditions.
- Explain the mechanism rather than only repeat a definition.
- Label observation and inference.
- Name a changed model feature or a remaining uncertainty.
Hint
Read the stated boundary and conditions before selecting a relationship. The unit’s worked examples show intermediate steps.
Response guidance — discuss after your attempt
400 J enters during the four-minute interval. In the simplified model it supports melting and changed particle interactions while the temperature stays approximately constant. It is not missing energy. Some real input can also reach the container or surroundings, so attributing all 400 J to the sample requires an idealized boundary and negligible losses.
Activity 2 · Read and extend the figure
Study the new labeled figure and its caption, then compare it with the associated teaching part.
Your task
What changes during the level interval? Explain what each important label represents. Add one missing feature that would be needed for a different question, and explain why the original figure leaves it out.
Success criteria
- Answer the figure question with its stated labels.
- Connect the visual representation to the scientific idea.
- Identify a specific limitation from the caption.
- Propose a useful change without misrepresenting supplied evidence.
Hint
The vertical scale includes the initial −10 °C ice temperature. The near-zero plateau at 2–6 minutes represents melting under ordinary-pressure, constant-input conditions, not stopped energy input. After melting, liquid temperature rises.
Response guidance — discuss after your attempt
Liquid fraction increases while energy continues to enter; average temperature remains nearly steady under the model assumptions. The vertical scale includes the initial −10 °C ice temperature. The near-zero plateau at 2–6 minutes represents melting under ordinary-pressure, constant-input conditions, not stopped energy input. After melting, liquid temperature rises.
Words to know
- heating curve
- Graph of temperature during energy input.
- phase
- A physical state or distinct material region, such as solid or liquid.
- plateau
- Approximately level portion of a graph.
- latent heat
- Energy per amount of substance associated with a phase change at nearly steady temperature.
- coexistence
- Presence of two phases together under the stated conditions.
- model
- A representation that explains selected features and makes predictions; it leaves other details out.
- evidence
- Relevant observations or records used to support or challenge a claim.
- system boundary
- The chosen limit separating the objects being studied from their surroundings.
- assumption
- A condition taken as true for a model or calculation and needing to be checked against the case.
In the real world
Illustrative ice–water data remain near 0 °C for four minutes while a heater supplies 100 J each minute.
Exit check
What changes during the level interval? Explain the relevant mechanism and one model limitation.
Check your explanation after answering
Liquid fraction increases while energy continues to enter; average temperature remains nearly steady under the model assumptions. The vertical scale includes the initial −10 °C ice temperature. The near-zero plateau at 2–6 minutes represents melting under ordinary-pressure, constant-input conditions, not stopped energy input. After melting, liquid temperature rises.
Explain your reasoning without notes. If a key idea is missing, revisit the lesson and try again.
Problem 1
Answer and explanation
Surface molecules can escape by evaporation below boiling temperature. They enter the surrounding air as water vapor.
Surface molecules can escape by evaporation below boiling temperature. They enter the surrounding air as water vapor.
Response criteria
- Use the supplied conditions and relevant evidence.
- Explain the scientific mechanism or calculation.
- State a meaningful limitation or testable next step.
Problem 2
Answer and explanation
Spacing, arrangement and allowed motion can change. In the gas compression model, volume changes while particle number and temperature are held fixed.
Spacing, arrangement and allowed motion can change. In the gas compression model, volume changes while particle number and temperature are held fixed.
Response criteria
- Use the supplied conditions and relevant evidence.
- Explain the scientific mechanism or calculation.
- State a meaningful limitation or testable next step.
Problem 3
Answer and explanation
More of the sample becomes liquid and particle arrangement/freedom of movement changes. Water molecules remain water; a plateau does not mean zero energy input or motionless particles.
Interpret the plateau with the stated phase-change conditions.
Track substance identity separately from arrangement and phase fraction.
More of the sample becomes liquid and particle arrangement/freedom of movement changes. Water molecules remain water; a plateau does not mean zero energy input or motionless particles.
Response criteria
- Use the named labels, directions or supplied quantities accurately.
- Connect the visual evidence to the scientific mechanism or calculation.
- State the relevant model conditions or limitation.
Problem 4
Answer and explanation
Insulation reduces the rate of energy transfer to cooler surroundings. It does not necessarily change the starting temperature or create thermal energy.
Insulation reduces the rate of energy transfer to cooler surroundings. It does not necessarily change the starting temperature or create thermal energy.
Response criteria
- Use the supplied conditions and relevant evidence.
- Explain the scientific mechanism or calculation.
- State a meaningful limitation or testable next step.
Problem 5
Answer and explanation
No. Temperature is not total energy or amount. Both are 25 °C under the supplied conditions.
No. Temperature is not total energy or amount. Both are 25 °C under the supplied conditions.
Response criteria
- Use the supplied conditions and relevant evidence.
- Explain the scientific mechanism or calculation.
- State a meaningful limitation or testable next step.
Problem 6
Hints
Use the illustrated study titled Compare heating by mass and material. Keep the observations, model and conditions separate.
Answer and explanation
50 versus 100 g water isolates mass in the supplied model and gives rises 4 versus 2 °C. The 50 g water versus 50 g model solid comparison isolates material and gives rises 4 versus 8 °C. Equal input does not impose equal temperature change. Verify input method, starting state, container and surroundings, repeat readings, and label the supplied values rather than claim actual collection.
50 versus 100 g water isolates mass in the supplied model and gives rises 4 versus 2 °C. The 50 g water versus 50 g model solid comparison isolates material and gives rises 4 versus 8 °C. Equal input does not impose equal temperature change. Verify input method, starting state, container and surroundings, repeat readings, and label the supplied values rather than claim actual collection.
Response criteria
- Choose separately controlled pairs.
- Explain amount/material response without equating heat with temperature.
- Specify input, tools, records and uncertainties.
Problem 7
Answer and explanation
50 °C in the stated equal-mass model. A different mass changes the energy amounts associated with each temperature change, so the simple midpoint would not generally apply.
Use equal amounts and the same substance/phase assumptions.
Do not add temperatures or apply the midpoint to unmatched masses.
50 °C in the stated equal-mass model. A different mass changes the energy amounts associated with each temperature change, so the simple midpoint would not generally apply.
Response criteria
- Use the named labels, directions or supplied quantities accurately.
- Connect the visual evidence to the scientific mechanism or calculation.
- State the relevant model conditions or limitation.
Problem 8
Answer and explanation
The particles have less space and collide with the walls more frequently under comparable temperature conditions, increasing the pressure.
The particles have less space and collide with the walls more frequently under comparable temperature conditions, increasing the pressure.
Response criteria
- Use the supplied conditions and relevant evidence.
- Explain the scientific mechanism or calculation.
- State a meaningful limitation or testable next step.
Problem 9
Answer and explanation
Spacing, arrangement and allowed motion can change. In the gas compression model, volume changes while particle number and temperature are held fixed.
Spacing, arrangement and allowed motion can change. In the gas compression model, volume changes while particle number and temperature are held fixed.
Response criteria
- Use the supplied conditions and relevant evidence.
- Explain the scientific mechanism or calculation.
- State a meaningful limitation or testable next step.
Problem 10
Answer and explanation
60 and 30 in the given pressure units. Particle size is unchanged; different spacing and wall-collision patterns explain the pressure change under the stated model.
Divide the supplied constant by each volume.
Hold temperature and amount comparable before attributing the result to compression.
60 and 30 in the given pressure units. Particle size is unchanged; different spacing and wall-collision patterns explain the pressure change under the stated model.
Response criteria
- Use the named labels, directions or supplied quantities accurately.
- Connect the visual evidence to the scientific mechanism or calculation.
- State the relevant model conditions or limitation.
Problem 11
Answer and explanation
No. Surface evaporation occurs below boiling. Water transfers from the cloth into the air, rather than vanish.
No. Surface evaporation occurs below boiling. Water transfers from the cloth into the air, rather than vanish.
Response criteria
- Use the supplied conditions and relevant evidence.
- Explain the scientific mechanism or calculation.
- State a meaningful limitation or testable next step.
Problem 12
Answer and explanation
Energy transfers between the warmer air/vapor and cool surface as conditions favor condensation. Water and energy require distinct accounts.
Energy transfers between the warmer air/vapor and cool surface as conditions favor condensation. Water and energy require distinct accounts.
Response criteria
- Use the supplied conditions and relevant evidence.
- Explain the scientific mechanism or calculation.
- State a meaningful limitation or testable next step.
Problem 13
Answer and explanation
The uncovered sample loses 1.7 g more. Escaping matter can carry energy, but temperature, evaporation energy and other transfer paths need additional evidence for an energy balance.
Compare mass changes for the same boundary and interval.
Keep the matter measurement distinct from an energy measurement.
The uncovered sample loses 1.7 g more. Escaping matter can carry energy, but temperature, evaporation energy and other transfer paths need additional evidence for an energy balance.
Response criteria
- Use the named labels, directions or supplied quantities accurately.
- Connect the visual evidence to the scientific mechanism or calculation.
- State the relevant model conditions or limitation.
Problem 14
Answer and explanation
No. They vibrate in the solid. Warming changes their motion; melting later changes the larger arrangement and freedom to move.
No. They vibrate in the solid. Warming changes their motion; melting later changes the larger arrangement and freedom to move.
Response criteria
- Use the supplied conditions and relevant evidence.
- Explain the scientific mechanism or calculation.
- State a meaningful limitation or testable next step.
Problem 15
Answer and explanation
Liquid fraction increases while energy continues to enter; average temperature remains nearly steady under the model assumptions.
Liquid fraction increases while energy continues to enter; average temperature remains nearly steady under the model assumptions.
Response criteria
- Use the supplied conditions and relevant evidence.
- Explain the scientific mechanism or calculation.
- State a meaningful limitation or testable next step.
Problem 16
Answer and explanation
No. A phase-change interpretation is supported by the growing liquid fraction, but 12 °C is not ordinary-pressure pure water’s melting point. Composition, pressure and other properties need to be checked.
Use both temperature and phase evidence.
Do not treat every plateau as water melting at a universal temperature.
No. A phase-change interpretation is supported by the growing liquid fraction, but 12 °C is not ordinary-pressure pure water’s melting point. Composition, pressure and other properties need to be checked.
Response criteria
- Use the named labels, directions or supplied quantities accurately.
- Connect the visual evidence to the scientific mechanism or calculation.
- State the relevant model conditions or limitation.