Scientific Inquiry & Diversity of Life — Print · Life Science & Scientific Inquiry, Grade 7
Five focused units, a three-session investigation, chapter review, and chapter quiz.
Printable chapter lessons and review.
Questions, Variables & Fair Investigations
Learning goals
- I can explain questions, variables & fair investigations.
- I can use evidence, a model, and stated assumptions to support a biological explanation.
Before this unit
Use the supplied vocabulary, distinguish an observation from an explanation, and identify any units or model assumptions. Revisit a connected earlier unit if needed; new terms are explained here.
Use three flexible 40–45-minute sessions: core background and Parts 1–2 with their checks; Parts 3–4 and the worked application; then remaining practice, a labeled model, revision, and the exit check. Checks completed during reading can count toward the practice set. Read one short part at a time. Investigations and chapter review/quiz have separate sessions, and flexible weeks allow more time.
In 1747 a naval surgeon named James Lind had a problem that had killed more British sailors than enemy action: scurvy. Everybody had a theory and most of them were wrong. What Lind did aboard HMS Salisbury was unusual. He took twelve sick sailors, put them in the same quarters, gave them the same food, and then split them into six pairs — each pair getting one of the six remedies people were arguing about. Cider for one pair, vinegar for another, seawater, a sulphuric acid elixir, a spice paste, and for the last pair two oranges and a lemon. Within six days the citrus pair were well enough to nurse the others. That is the whole shape of a fair test: change one thing, hold everything else the same, and see what follows.
Lind's design had the three parts every investigation needs. The thing he deliberately changed is the independent variable — the remedy. The thing he measured to see what happened is the dependent variable — how the sailors' condition changed. And everything he deliberately kept the same across all six pairs — the diet, the quarters, the starting severity — are the controlled variables. If you can name those three for an investigation, you can judge whether its conclusion is worth anything. If you cannot, the investigation is probably not answering the question it claims to.
The reason this matters is that a question like "do plants grow better with more water?" is not yet testable. It does not say what would count as better, how much more water, or what else would be held steady. A testable question names the change, the measurement and the conditions: "Does 10 mL of water a day produce more height gain over seven days in bean seedlings than 5 mL, with light, soil, pot size and temperature held the same?" That version can come out wrong, which is the point of it. And it protects you against a confound — a second factor that changed alongside the one you meant to test, so that when a difference appears you cannot tell which factor produced it. A confound does not make results useless; it makes them unable to separate causes, which is a different and more precise complaint.
Build your understanding
Where this fits
This is where the course starts, and it starts with method rather than content on purpose. Everything in the units that follow — cells, body systems, ecosystems, evolution — rests on somebody having designed a comparison good enough to trust. This unit is about how that is done, and the rest of Chapter 1 adds the measuring, the graphing and the reasoning that go with it.
Use three flexible 40–45-minute sessions: core background and Parts 1–2 with their checks; Parts 3–4 and the worked application; then remaining practice, a labeled model, revision, and the exit check. Checks completed during reading can count toward the practice set. Read one short part at a time. Investigations and chapter review/quiz have separate sessions, and flexible weeks allow more time.
Part 1 · Turning a broad question into a comparison
Start with the vague version and interrogate it. "Does fertiliser help plants?" invites four questions back. Which plants? How much fertiliser, compared with how much? Helps in what measurable way — height, leaf count, mass, time to flower? Over how long? Each answer narrows the question until it names a comparison you could actually set up on a windowsill.
The finished version always has the same three slots. What you will change, and to what values: 0 g against 2 g of the same fertiliser. What you will measure, with units: height in centimetres after fourteen days. What you will hold the same: species, pot size, soil, starting height, water volume, light, temperature. Writing those three lists before you begin is the single most useful habit in this course, because it exposes the problems while they are still cheap to fix.
A good test of whether a question is testable is to ask what result would prove you wrong. "Plants like light" cannot be wrong, so it is not yet a scientific question. "Seedlings grown 20 cm from the window will gain more height in fourteen days than seedlings grown 2 m away, with everything else matched" can be wrong, and that is what makes it worth doing.
Pause and explain
Rewrite "does music help plants grow?" as a testable question.
Check your reasoning after answering
Something like: do bean seedlings exposed to music at 60 decibels for two hours a day gain more height over fourteen days than identical seedlings in silence, with species, pot, soil, water, light and temperature held the same? It names what changes, what is measured and in what units, over what period, and what is held constant — so a result could contradict it.
Part 2 · Spotting a confound before it ruins the result
A confound is a second factor that varies along with the one you meant to test. Suppose Group A gets 10 mL of water a day on a bright windowsill and Group B gets 5 mL on a dim shelf. A grows more. Water and light both differed, so the result is real but it cannot be attributed: you have measured the combined effect of two changes and have no way to divide it between them.
Confounds hide in conditions nobody thought to write down. The bright windowsill is also warmer. The pots at the end of the row dry out faster. The seeds from the bottom of the packet were smaller to begin with. The second week was cloudier than the first. Each of these can produce a difference that looks exactly like the one you were testing for, which is why listing the controlled variables beforehand matters more than it sounds.
There are two defences. Match conditions deliberately, so the only planned difference is the independent variable. And randomise what you cannot match — if you have twenty seedlings and two trays, assign them to trays by drawing lots rather than by picking, so that any hidden difference between the seedlings is spread across both groups instead of landing in one.
Pause and explain
A student finds that plants on the kitchen windowsill grow taller than plants in the hallway, and concludes that light causes growth. What has gone wrong?
Check your reasoning after answering
Light is not the only thing that differs between a kitchen windowsill and a hallway. The windowsill is probably warmer, may be more humid from cooking, and the plants there may be watered more often because they are seen more often. Any of these could produce the difference, so the comparison cannot attribute it to light.
Part 3 · Repeating, and recording what you would rather not
Lind's experiment had two sailors per treatment. That is enough to notice something dramatic and far too few to be sure of anything subtle — two people can differ for a hundred reasons that have nothing to do with the remedy. Repetition is the defence against being fooled by one unusual individual. Grow ten seedlings per group rather than one, and the group's average carries information that a single plant never could.
Repeats also give you something a single measurement cannot: a sense of how much results vary on their own. If your five control plants gain 3, 4, 4, 5 and 4 cm, you know the ordinary spread is about 2 cm, so a treatment group averaging 4.5 cm has told you nothing. If the controls gain 3, 4, 4, 5 and 4 cm and the treatment group gains 11, 12, 10, 12 and 11, the difference is far outside the ordinary spread, and that is what makes it convincing.
Record every result, including the ones that went wrong. A seedling that died, a pot that was knocked over, a reading you think you misread — write them down with a note. Discarding inconvenient results quietly is how an honest person produces a false conclusion, because the discards are rarely random; they tend to be the ones that disagreed.
Pause and explain
Why is a single plant in each group not enough, even if you measure it very carefully?
Check your reasoning after answering
Because individual plants differ for reasons unconnected to the treatment — seed size, germination date, position, a damaged root. With one plant per group you cannot tell a treatment effect from ordinary individual variation. Several plants per group give an average and show how much variation there is anyway, which is what a difference has to exceed to be convincing.
Part 4 · Revising a plan when you cannot control everything
Real investigations are done in kitchens and gardens, not sealed chambers, and some factors cannot be held constant. The honest response is not to abandon the comparison but to narrow what you claim from it. If you cannot control temperature, record it, and say that the conclusion holds for the range you observed. If both trays had to sit in the same window, say so, and note that you have not tested whether position mattered.
Stating a limitation is a strength, not an apology. "Watering at 10 mL daily was associated with greater height gain than 5 mL in this trial of ten seedlings over fourteen days, at temperatures between 18 and 22 degrees, with light and soil matched" is a claim somebody can check and build on. "More water makes plants grow" is not, and it is wrong for most plants past a certain point anyway.
The last revision to consider is the cheapest one: run the comparison again. A result that reappears under slightly different conditions is far stronger than one careful run, because the things you failed to control are unlikely to have fallen the same way twice.
Pause and explain
Your windowsill is the only place with enough light, so both groups must share it. What should you do?
Check your reasoning after answering
Run the comparison there, but control position deliberately: assign pots to places at random and rotate them daily so no group sits permanently in the brightest spot. Then record that light was shared and rotated, and limit the claim to those conditions. Saying what you could not control, and what you did instead, is part of the result.
Apply the whole unit · Evaluate a seedling comparison
Illustrative record, not a measured experiment: Group A receives 10 mL of water daily and sits in bright light; Group B receives 5 mL daily and sits in dim light. After seven days, Group A has gained 4 cm in height and Group B has gained 1 cm.
Your task
Identify the intended variable, the measured outcome and the confound. Propose a fairer comparison, and state what the current record does establish.
What your response should show
- Explain the relevant biological process accurately.
- Use the supplied evidence and show calculation steps with units where needed.
- Connect a labeled model or mechanism with the claim.
- State an assumption, evidence limitation, or useful next observation.
Response guidance — after your attempt
Name what the investigator meant to change — the daily water volume, 10 mL against 5 mL — and what was measured, height gain in centimetres over seven days.
Find the second factor that changed with it: light differed too, bright against dim, so two things varied at once.
State the consequence precisely: the 3 cm difference is real, but it cannot be divided between water and light, so neither can be credited with it.
Propose the fix: hold light identical for both groups and vary only water, with several plants per group, the same species, soil, pot size and starting height.
The intended independent variable is the daily volume of water, 10 mL against 5 mL, and the dependent variable is height gain in centimetres over seven days. Group A gained 4 cm and Group B gained 1 cm, a difference of 3 cm. But light was also different — bright for A, dim for B — and that is a confound: two factors changed together, so the record cannot say whether the extra growth came from the water, the light, or some combination. What it does establish is that the whole package of more water plus more light was associated with more height gain here, which is worth knowing and is not the same as a claim about water. A fairer comparison would place both groups under identical light, hold species, soil, pot size, starting height and temperature the same, vary only the water, and use several plants in each group rather than one, so that ordinary variation between individuals can be seen and allowed for. It would also be worth recording the temperature and rotating the pots, since the brighter position is usually the warmer one.
Scientific references for this unit
Parent / teacher teaching notes
Ask for a because-statement and a labeled relationship, not just a memorized word. Work through one calculation step at a time, permit oral or diagram responses, and use flexible sessions for difficult reading. Compare the learner’s actual evidence with the supplied model; do not reward copying or agreement with a personal preference. No private family, genetic, or medical records are required.
The key idea
Science begins with questions about the natural world that observations can help answer. A question such as whether equal-sized paper samples absorb different amounts of water specifies something we can compare. A preference such as which color is nicest needs a stated judgment criterion; a measurement cannot decide everyone’s preference. Asking a testable question does not require predicting the correct answer in advance.
Worked examples
Example 1 · Find the three variables in a real trial
- The independent variable is the factor deliberately varied between groups: which remedy each pair received.
- The dependent variable is what was measured as an outcome: the change in each sailor's condition, judged by fitness for duty.
- The controlled variables are what was held the same: diet, quarters, and selecting sailors whose scurvy was at a similar stage.
A design can be sound in structure and still too small to be convincing. Judge both.
Example 2 · Decide whether a difference can be attributed
- List what differed between the trays: fertiliser, and position — which means light and probably temperature as well.
- Check whether the difference can be split: with two or more factors varying together, any outcome could come from either, or from both.
- Decide what the result does support: the combination was associated with more growth, and nothing more specific.
Ask what else changed. If the answer is anything at all, the result cannot attribute a cause.
Avoid these mistakes
- Mistake: a question is testable because it is about science. "Does music help plants?" names no measurement and no conditions; a testable version states the change, the units, the duration and what is held the same.
- Mistake: a confound makes the data worthless. The 3 cm difference in the seedling record is real — what it cannot do is say which of the two changed factors produced it.
- Mistake: one plant per group is enough if you measure carefully. Careful measurement of one individual still cannot separate a treatment effect from ordinary variation between individuals.
- Mistake: results that went wrong should be left out. Discards are rarely random — they tend to be the ones that disagreed — so leaving them out quietly is how an honest person reaches a false conclusion.
Check your understanding
Why does defining the outcome before testing help?
Discuss the answer
It keeps the comparison consistent and reduces the temptation to choose whichever observation later supports a favorite explanation.
Two plant groups differ in both soil and water. What claim is too strong?
Discuss the answer
A claim that water alone caused their difference is too strong because soil could also influence growth; separate or control the factors.
Words to know
- testable question
- A question naming what will be changed, what will be measured and in what units, and what is held the same — so that a result could contradict it.
- independent variable
- The one factor the investigator deliberately changes, such as the daily volume of water.
- dependent variable
- The outcome measured to see what the change produced, such as height gain in centimetres.
- controlled variable
- A factor deliberately held the same across all groups so it cannot explain any difference found.
- confound
- A second factor that varied alongside the independent variable, so a difference cannot be attributed to either one.
Extend your scientific explanation
Compare a second supplied example or the linked educational reference. Identify a connection, a model limit, and an additional observation that would test the explanation.
In the real world
Use a clear question, reliable observations, and a biological mechanism to evaluate a claim. State what remains uncertain before applying a classroom model to a different setting.
Exit check
Does repeating an unfair test make it fair?
Check your explanation after answering
No. Repetition can reveal variability while repeating the same confound. The method must change to separate the competing explanations.
Explain your reasoning without notes. If a key idea is missing, revisit the lesson and try again.
Measurements, Microscopes & Scale
Learning goals
- I can explain measurements, microscopes & scale.
- I can use evidence, a model, and stated assumptions to support a biological explanation.
Before this unit
Use the supplied vocabulary, distinguish an observation from an explanation, and identify any units or model assumptions. Revisit a connected earlier unit if needed; new terms are explained here.
Use three flexible 40–45-minute sessions: core background and Parts 1–2 with their checks; Parts 3–4 and the worked application; then remaining practice, a labeled model, revision, and the exit check. Checks completed during reading can count toward the practice set. Read one short part at a time. Investigations and chapter review/quiz have separate sessions, and flexible weeks allow more time.
Antoni van Leeuwenhoek, a cloth merchant in Delft with no scientific training, ground small glass beads into lenses and in 1676 reported seeing living things in a drop of water so small that nobody believed him. The Royal Society sent people to check. He was right, and nobody matched the quality of his observations for more than a century. The surprising part is that his microscopes were not the most powerful of his day in the usual sense — compound microscopes with two lenses could magnify more. What his single tiny bead gave him was resolution: the ability to show two close things as two things rather than one blur. Magnification without resolution just gives you a bigger blur, and that is the single most useful idea in this unit.
Magnification is how many times larger the image is than the object. On a compound microscope it is the eyepiece lens multiplied by the objective lens: a 10× eyepiece with a 40× objective gives 400× in total. Note what this tells you and what it does not. It tells you the enlargement. It does not tell you the size of the specimen, and it does not tell you how much detail you can see. Pushing the magnification past the point where the resolution gives out is called empty magnification — the image grows and the information does not.
Sizes at this scale need their own unit. A micrometre, written µm, is a thousandth of a millimetre, and a nanometre is a thousandth of a micrometre. A human hair is roughly 70 µm across, a plant cell 50 µm, a red blood cell about 8 µm, a bacterium 1 to 2 µm. To get an actual size out of an image you need a scale bar — a line drawn on the image with its real length stated — and the habit of calibration, which means checking your measuring system against a known standard before trusting it. A scale bar lets you measure the specimen with a ruler on the page and convert, which works no matter how the image was later enlarged or shrunk.
Build your understanding
Where this fits
The last unit set out how to design a comparison. A comparison is only as good as what you can measure, and in life science most of what matters is too small to see. This unit is about measuring small things honestly: the units, the difference between making an image bigger and seeing more detail in it, and how to get a real size out of a photograph.
Use three flexible 40–45-minute sessions: core background and Parts 1–2 with their checks; Parts 3–4 and the worked application; then remaining practice, a labeled model, revision, and the exit check. Checks completed during reading can count toward the practice set. Read one short part at a time. Investigations and chapter review/quiz have separate sessions, and flexible weeks allow more time.
Part 1 · Choosing a unit and reading it consistently
Metric prefixes make the arithmetic easy if you hold the chain in mind: a metre is a thousand millimetres, a millimetre is a thousand micrometres, a micrometre is a thousand nanometres. So one millimetre is a million nanometres, and converting is multiplying or dividing by a thousand at each step. Writing the unit after every number is not pedantry; a number without a unit at this scale is meaningless and mistakes of a thousandfold are easy to make.
Choose the unit that keeps the numbers readable. A cell is better described as 50 µm than as 0.05 mm or 50,000 nm, even though all three are the same length, because the first is the one you can compare at a glance with the 8 µm red blood cell and the 1 µm bacterium. When you tabulate measurements, pick one unit for the column and convert everything into it before comparing.
Read instruments consistently too. Always view a scale square-on rather than at an angle, read to the same precision each time, and record what you actually see rather than what you expect. If a ruler reads between two marks, say so — 1.25 cm with a note that the smallest division is 0.1 cm is more honest than 1.3 cm presented as exact.
Pause and explain
A cell measures 0.04 mm across. Express that in micrometres and in nanometres.
Check your reasoning after answering
A millimetre is a thousand micrometres, so 0.04 mm is 0.04 × 1000 = 40 µm. A micrometre is a thousand nanometres, so 40 µm is 40,000 nm. The same length written three ways; 40 µm is the clearest here because it compares directly with other cell sizes.
Part 2 · Magnification is enlargement, not size
On a compound microscope, light passes through the objective lens close to the specimen and then the eyepiece lens near your eye, and each one enlarges. Total magnification is the product: a 10× eyepiece with a 4× objective gives 40×, with a 10× objective gives 100×, and with a 40× objective gives 400×. Multiply, never add.
The number that results describes the image, not the specimen. Two different cells viewed at 400× are both enlarged four hundred times, and one may still be six times longer than the other. Conversely the same cell photographed at 100× and at 400× is the same cell. Confusing enlargement with size is the most common error on microscope questions, and the way to avoid it is to ask what the number is a property of.
Magnification also costs you field of view. At 40× you see a wide area and can find what you are looking for; at 400× you see a small patch in much more detail. The standard practice is to locate the specimen at low power, centre it, and only then switch up — which is why microscopes are built with the lowest-power objective in place.
Pause and explain
A microscope has a 10× eyepiece and a 40× objective. What is the total magnification, and does it tell you how big the cell is?
Check your reasoning after answering
The total magnification is 10 × 40 = 400×. It does not tell you the cell's size. It says only that the image is four hundred times larger than the object; to get an actual size you need a scale bar on the image, or a calibrated eyepiece graticule, and then a measurement and a conversion.
Part 3 · Getting a real size out of an image
A scale bar solves the problem that an image can be printed, cropped or enlarged after the fact. The bar is drawn on the image itself, so it is enlarged by exactly the same amount as everything else, and its real length is stated beside it. Measure the bar on the page with a ruler, measure the specimen the same way, and the ratio between them is the same as the ratio between their real lengths.
Work it as a proportion. Suppose a 4 cm scale bar represents 200 µm, and the cell in the image spans 1.2 cm. The cell is 1.2 ÷ 4 = 0.3 of the bar's length, so its real length is 0.3 × 200 = 60 µm. Setting it out as a fraction of the bar, rather than trying to compute the magnification first, avoids most of the arithmetic errors.
This is where calibration matters. The whole calculation assumes the stated bar length is correct for the image as it is printed in front of you. If the image was stretched in one direction, or the bar was added carelessly, the answer inherits the error. A careful write-up states the assumption: the estimate of 60 µm holds if the scale bar is accurate for this reproduction.
Pause and explain
On an image, a 5 cm scale bar represents 100 µm and a cell spans 2 cm. How long is the cell?
Check your reasoning after answering
The cell is 2 ÷ 5 = 0.4 of the scale bar's length, so its real length is 0.4 × 100 = 40 µm. The method works whatever the printing size, because the bar is enlarged by exactly the same factor as the cell, and it does not require knowing the magnification at all.
Part 4 · Saying what the instrument can and cannot establish
Every instrument has a resolution limit, and for a light microscope it is about 200 nm, set by the wavelength of visible light itself. That is small enough to separate two objects 0.2 µm apart and no closer. A bacterium at 1 µm is comfortably visible; a ribosome at 20 nm is ten times below the limit and cannot be seen at any magnification, which is why turning the magnification up does not help.
This is the honest way to read an apparent absence. If a light micrograph shows no internal structure in a bacterium, that is not evidence the bacterium is empty — it is evidence the instrument could not resolve what is in there. Electron microscopes, which use electrons rather than light, push the limit down by about a thousandfold, and that is how the interior of a cell was finally settled.
So a measurement report should state three things: the value with its unit, how it was obtained, and what the method could not determine. "The cell is approximately 60 µm long, estimated from a stated 200 µm scale bar, assuming the bar is accurate for this reproduction; the image cannot establish the cell's depth or whether it was distorted in preparation" is a complete scientific statement. A bare "60 µm" is not.
Pause and explain
Why does increasing magnification not reveal a ribosome under a light microscope?
Check your reasoning after answering
Because the limit is resolution, not enlargement. A light microscope cannot separate two points closer than about 200 nm, and a ribosome is around 20 nm. Magnifying further produces a larger blur with no extra detail — empty magnification. Seeing ribosomes requires an electron microscope, which resolves roughly a thousand times finer.
Apply the whole unit · Calibrate a supplied cell image
Illustrative image record, not a measured specimen: a 4 cm scale bar on the image represents 200 micrometres, and the cell in the image spans 1.2 cm. The microscope setting is listed as a 10× eyepiece with a 40× objective.
Your task
Calculate the cell's estimated length and the total magnification, explain why these are different kinds of quantity, and state one assumption the calibration rests on.
What your response should show
- Explain the relevant biological process accurately.
- Use the supplied evidence and show calculation steps with units where needed.
- Connect a labeled model or mechanism with the claim.
- State an assumption, evidence limitation, or useful next observation.
Response guidance — after your attempt
Compare the cell with the scale bar on the page: 1.2 cm ÷ 4 cm = 0.3, so the cell is three tenths of the bar's length.
Convert using the bar's stated value: 0.3 × 200 micrometres = 60 micrometres, which is the estimated length of the specimen.
Calculate the magnification separately by multiplying the lenses: 10 × 40 = 400×, which describes the image, not the cell.
State the assumption: the calculation holds only if the 4 cm bar genuinely represents 200 micrometres for this reproduction of the image.
The cell is approximately 60 micrometres long and the total magnification is 400×, and the two numbers answer different questions. The length comes from the scale bar: the cell spans 1.2 cm against the bar's 4 cm, which is 0.3 of it, and 0.3 × 200 micrometres gives 60 micrometres. That is a property of the specimen. The magnification comes from the lenses: a 10× eyepiece multiplied by a 40× objective gives 400×, and that is a property of the image, describing how much the view was enlarged rather than how big anything is. You could photograph a much smaller cell at the same 400× and a much larger one too. The calculation rests on the stated calibration being right for the image as printed — if the reproduction was scaled unevenly, or the bar was added to the wrong version of the image, the 60 micrometre estimate carries that error. It is also worth saying what the record cannot establish: the cell's depth, whether preparation distorted its shape, and anything about structures smaller than the roughly 200 nanometre resolution limit of a light microscope.
Scientific references for this unit
Parent / teacher teaching notes
Ask for a because-statement and a labeled relationship, not just a memorized word. Work through one calculation step at a time, permit oral or diagram responses, and use flexible sessions for difficult reading. Compare the learner’s actual evidence with the supplied model; do not reward copying or agreement with a personal preference. No private family, genetic, or medical records are required.
The key idea
A measurement combines a number, a unit, and a method. A length of 12 is incomplete until we know whether it means millimeters, centimeters, or meters. Microscopes let us observe features too small for unaided eyes, but a larger image is not automatically a clearer image. Magnification describes enlargement; resolution describes whether nearby details can be distinguished.
Worked examples
Example 1 · Separate the two numbers
- Calculate both magnifications: 10 × 10 = 100× in each case, so the enlargement is identical.
- Identify what actually differs: the specimens are different sizes, which is a property of the cells, not of the instrument.
- Name the confusion: filling the field of view depends on specimen size and magnification together, so it cannot measure either on its own.
Ask whether a number describes the instrument or the specimen. Magnification describes the instrument.
Example 2 · Judge an absence
- Check the instrument's limit: a light microscope resolves to about 200 nanometres regardless of magnification.
- Compare the limit with the structures in question: bacterial ribosomes are around 20 nanometres, ten times below the limit.
- Decide what the image supports: it shows the cell's outline and overall shape, and nothing about structures below 200 nanometres.
An absence in an image is evidence only if the instrument could have shown the thing had it been there.
Avoid these mistakes
- Mistake: a higher magnification always shows more. Past the resolution limit — about 200 nanometres for a light microscope — the image gets bigger and no more detailed, which is called empty magnification.
- Mistake: magnification tells you the size of the specimen. 400× says the image is four hundred times larger than the object; the size needs a scale bar and a conversion.
- Mistake: eyepiece and objective add. They multiply: 10× with 40× is 400×, not 50×.
- Mistake: nothing visible means nothing there. A light micrograph of a bacterium looks featureless because its contents are ten times below the resolution limit, not because the cell is empty.
Check your understanding
Why is “a cell is 20 long” incomplete?
Discuss the answer
It omits the unit and measurement method. A cell might be 20 micrometers long, but the number alone cannot establish its size.
Does changing from 40× to 100× make the real cell larger?
Discuss the answer
No. It enlarges the image and changes the viewed area; the actual cell size is unchanged.
Words to know
- magnification
- How many times larger the image is than the object; on a compound microscope, eyepiece multiplied by objective.
- resolution
- The smallest separation at which two points still appear as two; about 200 nanometres for a light microscope, and the real limit on what you can see.
- micrometer
- A thousandth of a millimetre, written µm — the working unit for cells, which run from about 1 µm for a bacterium to 50 µm for a plant cell.
- scale bar
- A line drawn on an image with its real length stated, so a size can be measured from the image however it was later enlarged.
- calibration
- Checking a measuring system against a known standard before trusting it; every size read from an image assumes its calibration is correct.
Extend your scientific explanation
Compare a second supplied example or the linked educational reference. Identify a connection, a model limit, and an additional observation that would test the explanation.
In the real world
Use a clear question, reliable observations, and a biological mechanism to evaluate a claim. State what remains uncertain before applying a classroom model to a different setting.
Exit check
Why does not seeing ribosomes fail to show that a cell lacks them?
Check your explanation after answering
They are too small for many classroom microscopes to resolve. Instrument limits can explain the missing visible detail.
Explain your reasoning without notes. If a key idea is missing, revisit the lesson and try again.
Tables, Graphs & Patterns in Data
Learning goals
- I can explain tables, graphs & patterns in data.
- I can use evidence, a model, and stated assumptions to support a biological explanation.
Before this unit
Use the supplied vocabulary, distinguish an observation from an explanation, and identify any units or model assumptions. Revisit a connected earlier unit if needed; new terms are explained here.
Use three flexible 40–45-minute sessions: core background and Parts 1–2 with their checks; Parts 3–4 and the worked application; then remaining practice, a labeled model, revision, and the exit check. Checks completed during reading can count toward the practice set. Read one short part at a time. Investigations and chapter review/quiz have separate sessions, and flexible weeks allow more time.
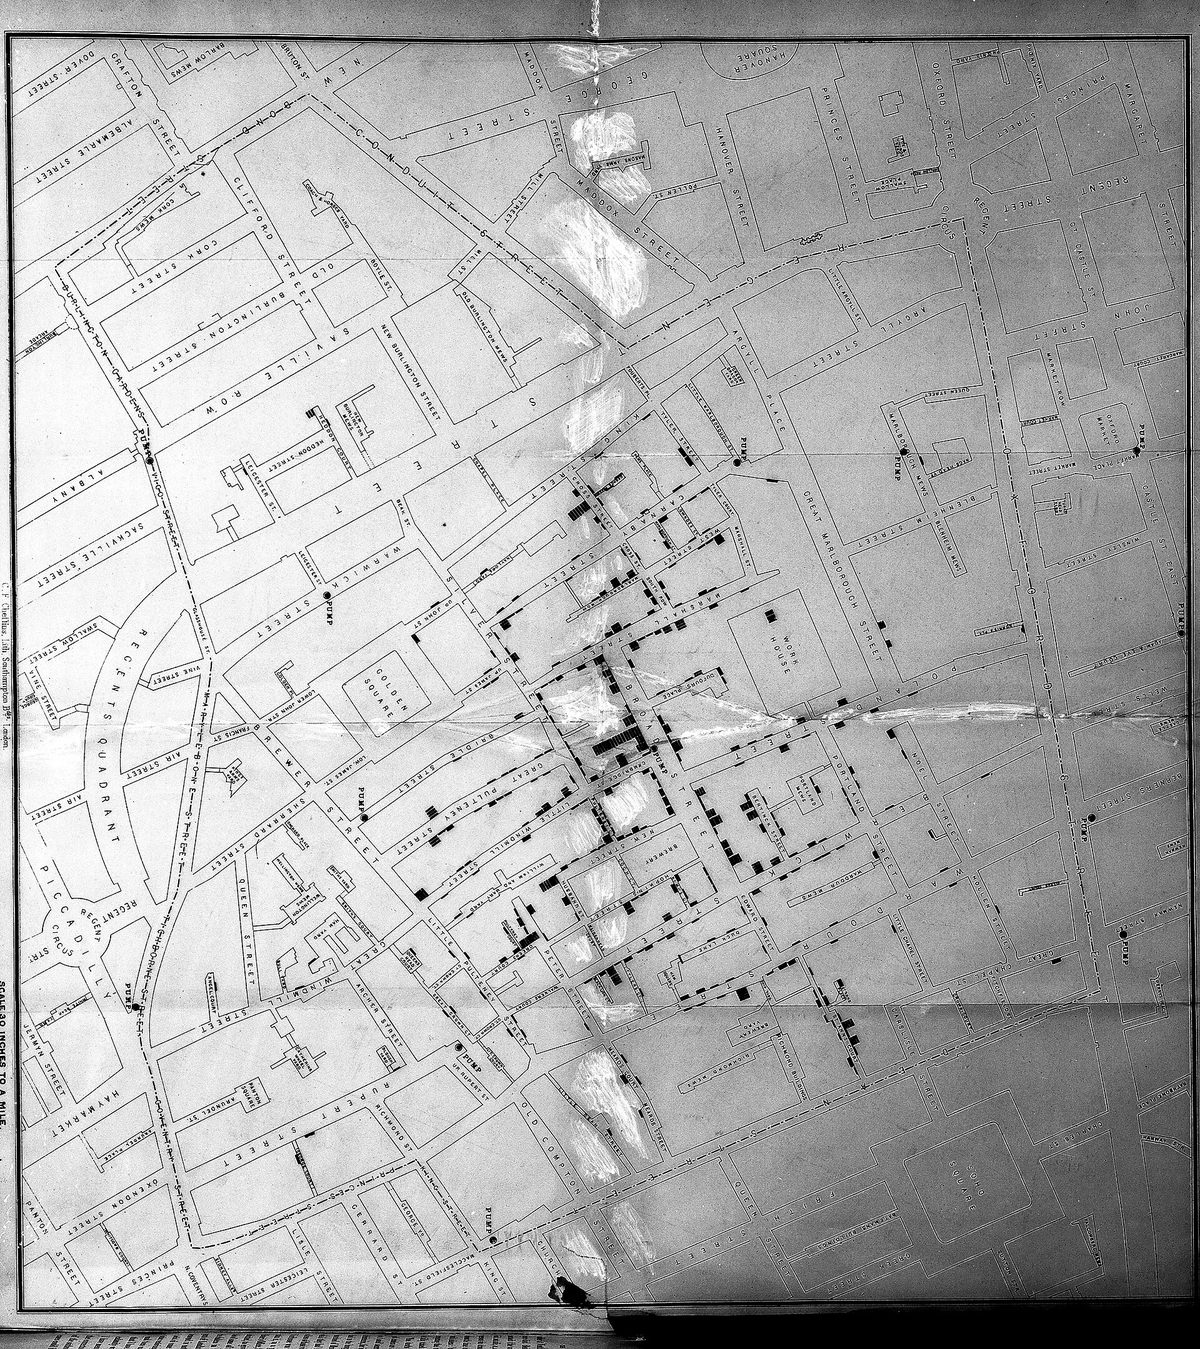
In the late summer of 1854, a cholera outbreak in Soho killed more than five hundred people in ten days. The accepted explanation was bad air. A doctor named John Snow did something different: he went door to door, recorded where each death had occurred, and drew them on a street map as small black bars. The map made a pattern visible that no list of names could — the deaths clustered tightly around one water pump in Broad Street, and thinned out with distance from it. The cases that did not fit turned out to confirm it. A nearby workhouse with its own well had almost no deaths. A brewery, where the workers drank beer, had none. Snow's map is the best demonstration there is of what organising data well can do: the numbers were available to everyone, and arranging them revealed something nobody had seen.
Most of the time you will be working with far smaller sets, and the first job is a table you or anyone else can check. Every column needs a heading with a unit, every row needs to be identifiable, and every measurement goes in — including the odd ones. Then you summarise. The mean is the familiar one: add the values and divide by how many there are. The range is the distance from the lowest to the highest, and it is the one people skip, which is a mistake, because a mean on its own hides everything about how spread out the measurements were.
Two numbers with the same mean can describe quite different situations, which is why both matter. The pattern you then describe has to be stated carefully. When two things change together, that is a correlation, and a correlation is a genuine finding that does not by itself establish that one caused the other — a third factor may drive both. And predicting beyond the range of your data is extrapolation, which is always a guess: seedlings given more water grow taller up to a point, and then drown, and no amount of data from the rising part of that curve warns you about the fall.
Build your understanding
Where this fits
You can now design a fair comparison and measure it honestly. That produces numbers, and numbers do not interpret themselves. This unit is about getting a pattern out of a set of measurements without reading in more than is there — which is the last tool you need before the final unit of the chapter puts claim, evidence and reasoning together.
Use three flexible 40–45-minute sessions: core background and Parts 1–2 with their checks; Parts 3–4 and the worked application; then remaining practice, a labeled model, revision, and the exit check. Checks completed during reading can count toward the practice set. Read one short part at a time. Investigations and chapter review/quiz have separate sessions, and flexible weeks allow more time.
Part 1 · A table somebody else could check
A good table is a record, not a summary. Each column gets a heading naming the quantity and its unit — "height gain / cm", not "height" — so nobody has to guess later. Each row identifies what was measured: plant 1, plant 2, and so on, rather than an anonymous list. Readings go in as they were taken, to the same number of decimal places, in the order they were taken.
Keep the raw measurements separate from anything calculated. If you work out means, put them in their own row or column clearly labelled, so a reader can check your arithmetic against the original numbers. A table where the raw values have been replaced by averages cannot be audited, and cannot be reanalysed if you later think of a better question.
Record the awkward entries too, with a note. "Plant 7: knocked over on day 4, not measured" is useful information. So is "plant 3: 11 cm — much larger than the others, grown from a visibly bigger seed". Those notes are what let you decide honestly later whether a value belongs in the analysis, instead of deciding it silently while you type.
Pause and explain
Why should raw measurements stay in the table even after you have calculated a mean?
Check your reasoning after answering
Because the mean cannot be checked or reinterpreted without them. Raw values let a reader verify the arithmetic, see how spread out the measurements were, spot an unusual reading, and recalculate if a better question comes up later. A table showing only averages is a conclusion, not a record.
Part 2 · Choosing axes and a scale that does not mislead
Put the thing you changed on the horizontal axis and the thing you measured on the vertical one — independent across the bottom, dependent up the side. Label both with quantity and unit. Then choose the scale: equal intervals all the way along, with the divisions sensible numbers, and the axis starting at zero unless there is a stated reason not to.
That last point is where graphs most often mislead, usually without anyone intending it. Plot heights of 4.0 cm and 4.5 cm on an axis running from 3.9 to 4.6 and one bar looks several times the other; plot the same values from zero and the difference looks like what it is, about a tenth. Neither graph lies about the numbers, but they leave very different impressions, so a truncated axis has to be marked clearly.
Pick the form that fits the data. Separate categories — treatment A against treatment B — call for a bar chart with gaps between the bars. A measured quantity changing continuously, such as height against day, calls for points plotted and, if there is a clear trend, a line of best fit drawn through them rather than a zigzag joining every dot.
Pause and explain
Two bars show 4.0 cm and 4.5 cm on an axis that starts at 3.9 cm. Why might a reader be misled?
Check your reasoning after answering
Because the visible part of each bar shows only the amount above 3.9 cm, so one bar appears several times taller than the other when the real difference is about one eighth. The numbers are correct and the impression is wrong. An axis starting at zero shows the true proportion, and a truncated axis must be clearly marked as one.
Part 3 · A summary that keeps the variation
Work an example. Treatment A produces height gains of 3, 4 and 5 cm; treatment B produces 1, 4 and 7 cm. Both means are 4 cm: A gives 12 ÷ 3 and so does B. If you reported only the means you would conclude the treatments performed identically. They did not. A's range is 5 − 3 = 2 cm, while B's is 7 − 1 = 6 cm, three times as wide.
That difference matters for what you can claim. A's plants behaved consistently, so a repeat would probably land near 4 cm again. B's results varied so much that the next plant could plausibly come in anywhere between 1 and 7, and its mean of 4 is not telling you much about any individual plant. The spread is information about how reliable the average is.
So report a mean with a range beside it, always. "4 cm (range 2 cm)" and "4 cm (range 6 cm)" are different findings, and only the pair of numbers distinguishes them. With small sets like these the range is the right measure; with larger sets scientists use more sophisticated measures of spread, but they are doing the same job.
Pause and explain
Two treatments both give a mean of 4 cm, with ranges of 2 cm and 6 cm. What does that tell you?
Check your reasoning after answering
That the averages agree while the consistency does not. The treatment with a 2 cm range produced similar results each time, so its mean describes its plants well. The one with a 6 cm range produced scattered results, so its mean of 4 cm tells you little about any individual plant and a repeat could easily give a different average.
Part 4 · Describing a pattern without overreaching
Two traps sit at the end of every analysis. The first is treating a correlation as a cause. Ice cream sales and drowning deaths rise together across a year, and neither causes the other — hot weather drives both. A correlation is worth reporting and worth investigating, and establishing a cause needs something more: a mechanism that explains how one would produce the other, and ideally a controlled comparison that changes one and watches the other.
The second is extrapolation — reading the pattern beyond the data you have. If seedlings given 5, 10 and 15 mL of water a day gained steadily more height, it does not follow that 100 mL would do better still, and in fact it would drown them. Your line describes the range you measured. Beyond it you are guessing, and the guess is least reliable exactly where the pattern is most likely to change.
The safe form of words names the range and the conditions. "Across 5 to 15 mL a day, more water was associated with more height gain in these ten seedlings over fourteen days" states what was found, where it holds, and leaves the question of larger volumes open — which is honest, because it is open.
Pause and explain
Why is a correlation between two measurements not enough to claim one causes the other?
Check your reasoning after answering
Because a third factor can drive both, as hot weather drives both ice cream sales and swimming deaths, and because the causation could run the other way. A causal claim needs a mechanism explaining how one would produce the other, and ideally a controlled comparison in which only the suspected cause is changed.
Apply the whole unit · Compare repeated height measurements
Illustrative records, not a measured experiment: under the same stated conditions and interval, treatment A produced height gains of 3, 4 and 5 cm, and treatment B produced 1, 4 and 7 cm.
Your task
Calculate the mean and the range for each treatment, then describe one way they are alike, one way they differ, and what these summaries cannot establish.
What your response should show
- Explain the relevant biological process accurately.
- Use the supplied evidence and show calculation steps with units where needed.
- Connect a labeled model or mechanism with the claim.
- State an assumption, evidence limitation, or useful next observation.
Response guidance — after your attempt
Mean of A: (3 + 4 + 5) ÷ 3 = 12 ÷ 3 = 4 cm. Mean of B: (1 + 4 + 7) ÷ 3 = 12 ÷ 3 = 4 cm.
Range of A: 5 − 3 = 2 cm. Range of B: 7 − 1 = 6 cm, three times as wide.
State the likeness and the difference: the averages are identical, while B's results are far more spread out than A's.
State the limits: three plants per treatment is a very small set, and nothing here explains why B varied more or whether the pattern would hold again.
Both treatments have a mean of 4 cm: A gives (3 + 4 + 5) ÷ 3 = 4 and B gives (1 + 4 + 7) ÷ 3 = 4. They are alike in their averages and quite unlike in their spread. A's range is 5 − 3 = 2 cm; B's is 7 − 1 = 6 cm, three times as wide. That difference changes what each mean is worth. A's plants behaved consistently, so 4 cm describes them well and a repeat would probably land near it. B's results scattered from 1 to 7 cm, so its mean of 4 cm describes no individual plant particularly and the next result could fall anywhere across that span. Reporting only the means would have hidden this entirely, which is why a mean should always travel with a measure of spread. What the summaries cannot establish is anything about cause. Three plants per treatment is a very small set, and the records do not say why B varied more — it could be uneven seed quality, uneven watering, differences in position, or chance. Nor can they support a prediction outside the conditions that were run. The useful next step would be more plants per treatment and a record of the conditions each one experienced, so that the source of B's variability can be looked for rather than guessed at.
Scientific references for this unit
Parent / teacher teaching notes
Ask for a because-statement and a labeled relationship, not just a memorized word. Work through one calculation step at a time, permit oral or diagram responses, and use flexible sessions for difficult reading. Compare the learner’s actual evidence with the supplied model; do not reward copying or agreement with a personal preference. No private family, genetic, or medical records are required.
The key idea
Data are recorded observations or measurements. A table preserves individual values, conditions, and units; a graph helps display relationships. Selecting a graph depends on the question. A line graph can show change over an ordered time sequence, while a bar graph compares separate categories. A graph makes a pattern easier to see but does not create evidence that was not measured.
Worked examples
Example 1 · Read what a map of data shows
- Identify the pattern: death density falls with distance from one pump, and two groups who did not use that pump were spared.
- Note why the exceptions strengthen it: the workhouse and brewery are cases where the suspected exposure was absent and the outcome was absent too.
- State the limit: the map shows an association between using one water source and dying, not the agent or the mechanism, which Snow could not identify.
The cases that break a pattern are often the most informative, because they test it.
Example 2 · Decide what a mean is hiding
- Calculate both means: X gives 20 ÷ 5 = 4 cm; Y gives 20 ÷ 5 = 4 cm.
- Calculate both ranges: X is 4 − 4 = 0 cm; Y is 8 − 0 = 8 cm.
- Compare what each tells you about an individual: X's plants all did the same thing, Y's did eight different things averaging to the same figure.
Never report a mean alone. The spread is half the result.
Avoid these mistakes
- Mistake: the mean is the result. Treatments A and B above both average 4 cm with ranges of 2 cm and 6 cm, which are quite different findings; a mean without a spread hides that.
- Mistake: correlation shows cause. Ice cream sales and drowning rise together because hot weather drives both; a causal claim needs a mechanism and a controlled comparison.
- Mistake: the line can be read past the data. Seedlings given 5 to 15 mL gained steadily more height, and 100 mL would drown them — extrapolation is guessing where the pattern is most likely to change.
- Mistake: a truncated axis is harmless. Bars of 4.0 and 4.5 cm drawn from 3.9 cm look several times different when the real gap is about an eighth; mark the break clearly or start at zero.
Check your understanding
Why is a missing measurement not automatically zero?
Discuss the answer
Missing means no valid observation was recorded. Zero claims that the measured quantity was actually zero.
How can uneven time spacing mislead a reader?
Discuss the answer
It can make the same change appear faster or slower because equal horizontal distances no longer represent equal times.
Words to know
- data
- The recorded measurements and observations themselves, kept raw so that any summary drawn from them can be checked.
- mean
- The sum of the values divided by how many there are; it should always be reported with a measure of spread beside it.
- range
- The distance from the lowest value to the highest, which shows how consistent a set of measurements was.
- correlation
- Two quantities changing together — a real finding, but not on its own evidence that one causes the other.
- extrapolation
- Predicting beyond the range of the data collected; always a guess, and least reliable where the pattern is most likely to change.
Extend your scientific explanation
Compare a second supplied example or the linked educational reference. Identify a connection, a model limit, and an additional observation that would test the explanation.
In the real world
Use a clear question, reliable observations, and a biological mechanism to evaluate a claim. State what remains uncertain before applying a classroom model to a different setting.
Exit check
Why is extending a seven-day growth line to a year uncertain?
Check your explanation after answering
The extension assumes the same growth rate and conditions far beyond the measured interval; resource limits and development can change the pattern.
Explain your reasoning without notes. If a key idea is missing, revisit the lesson and try again.
Models, Claims, Evidence & Reasoning
Learning goals
- I can explain models, claims, evidence & reasoning.
- I can use evidence, a model, and stated assumptions to support a biological explanation.
Before this unit
Use the supplied vocabulary, distinguish an observation from an explanation, and identify any units or model assumptions. Revisit a connected earlier unit if needed; new terms are explained here.
Use three flexible 40–45-minute sessions: core background and Parts 1–2 with their checks; Parts 3–4 and the worked application; then remaining practice, a labeled model, revision, and the exit check. Checks completed during reading can count toward the practice set. Read one short part at a time. Investigations and chapter review/quiz have separate sessions, and flexible weeks allow more time.
In 1847 Ignaz Semmelweis was working in a Vienna maternity hospital with two wards. In one, staffed by doctors and students, far more mothers died of childbed fever than in the other, staffed by midwives. The mothers knew it and begged to be admitted to the second ward. Semmelweis noticed that the doctors came to deliveries straight from dissections and the midwives did not, and he required everyone to wash their hands in a chlorinated lime solution. The death rate in the doctors' ward fell sharply within months. His evidence was strong and his colleagues largely rejected it, partly because he could not say what was being transferred — germ theory was still decades away. The episode shows both halves of this unit: how powerful a well-supported claim is, and how much depends on the reasoning that connects it to its evidence.
A scientific explanation has three parts and they are worth naming separately. The claim is the statement you are asserting — what you think is true. The evidence is the specific observations or measurements that support it, with numbers and units where they exist. The reasoning is the connection: why those particular observations support that particular claim, usually by way of a mechanism that explains how one thing would produce the other. Semmelweis had a strong claim and strong evidence; the reasoning is where he was stuck, and it is where most student answers are weakest too.
Alongside the explanation sits the model — a simplified representation used to think with. A diagram of a cell, an equation for photosynthesis, a food web, a physical apparatus standing in for a river: all are models, and all leave things out deliberately. That is what makes them useful. It also means every model has a limitation, a respect in which it does not match the thing it represents, and a good scientific statement names the main one rather than waiting to be caught out by it. "This food web shows who eats whom but not how much energy passes at each step" is a stronger sentence than the diagram alone.
Build your understanding
Where this fits
You can design a comparison, measure it, and summarise what came out. The last step is turning that into a statement somebody else should accept — and knowing what would make them right to refuse. This unit puts claim, evidence and reasoning together, and it closes the methods half of the chapter before the final unit turns to living things themselves.
Use three flexible 40–45-minute sessions: core background and Parts 1–2 with their checks; Parts 3–4 and the worked application; then remaining practice, a labeled model, revision, and the exit check. Checks completed during reading can count toward the practice set. Read one short part at a time. Investigations and chapter review/quiz have separate sessions, and flexible weeks allow more time.
Part 1 · Separating what you saw from what you concluded
An observation is what anybody present could have recorded: the covered soil lost 5 g, the uncovered soil lost 12 g, the readings were taken twelve hours apart. An inference is what you concluded from it: that the cover reduced evaporation. The first can be checked by repeating the measurement; the second is an argument about what the measurement means.
Mixing them is the commonest flaw in a write-up, and it usually shows up as a sentence with no numbers in it. "The cover stopped the water escaping" reads like a finding and is actually an interpretation with the evidence left out. "The covered sample lost 5 g against the uncovered sample's 12 g over the same twelve hours, so the cover was associated with 7 g less loss" keeps them apart and lets a reader judge.
A useful discipline is to write the observations first, as a list with units, before writing a single interpretive sentence. Then every claim you make afterwards has to point back to a line on that list. If it cannot, you have found something you believe for reasons that are not in your data.
Pause and explain
Classify each as observation or inference: (a) the uncovered soil lost 12 g; (b) covering soil reduces evaporation.
Check your reasoning after answering
(a) is an observation — a measured value anybody could check by repeating the weighing. (b) is an inference: it generalises from the comparison to a claim about what covering does, which goes beyond the single measurement and depends on the conditions having been otherwise matched.
Part 2 · Reasoning is the mechanism, not a restatement
The weakest reasoning is the kind that just says the evidence again. "The cover reduced evaporation because the covered soil lost less water" has a because in it and explains nothing — it restates the measurement. Reasoning has to supply the link: water leaves soil as vapour from the exposed surface, a cover reduces the area in contact with moving air and traps humid air above the soil, so fewer molecules escape per minute.
Once you state a mechanism you get something valuable: a prediction you can test. If the mechanism is about exposed surface and air movement, then a cover with holes in it should perform somewhere between the two, a cover in still air should matter less than one in a draught, and a wider container should lose more than a narrow one. Any of these could fail, and that is what makes the mechanism a scientific proposal rather than a story.
Semmelweis is the cautionary case. His mechanism — some material carried on hands from dissections — was essentially right, but he could not name it or show it, so colleagues who disliked the implication could dismiss the reasoning while the evidence sat in front of them. A mechanism you can state and test is what turns a correlation into an explanation people can act on.
Pause and explain
Why is "the cover reduced loss because less water was lost" not reasoning?
Check your reasoning after answering
Because it restates the evidence instead of connecting it to the claim. Reasoning has to supply a mechanism: water leaves as vapour from the exposed surface, and a cover reduces that exposed area and traps humid air above the soil, so fewer molecules escape. That version also predicts what a perforated cover or a draught would do, which the restatement cannot.
Part 3 · What a model is for, and what it leaves out
A model is a deliberate simplification built for a purpose, and the purpose decides what can be left out. A food web drawn as arrows between species is excellent for showing who depends on whom and useless for showing how much energy moves. A diagram of a cell shows the arrangement of organelles and misrepresents their crowding badly — real cytoplasm is packed, not spacious. Neither is wrong; each is answering a different question from the one it fails at.
So judging a model means asking what it was for. "Is this model accurate?" is the wrong question; "is this model adequate for the question I am asking?" is the right one. A globe is a poor model of Earth's interior and a good one of the arrangement of continents, and nothing about the globe changes between those two judgements.
State the main limitation when you use one. It costs a sentence and it prevents the error the model invites: that a cell is roomy, that a food chain is a single line, that an equation for photosynthesis describes one event rather than a long sequence of reactions. Naming the simplification is part of using the model honestly.
Pause and explain
A diagram shows a cell's organelles spaced neatly apart. Name its purpose and its main limitation.
Check your reasoning after answering
Its purpose is to show which organelles a typical cell contains and roughly where they sit, which it does clearly. Its main limitation is the spacing: a real cell is extremely crowded, with contents behaving more like a gel than a fluid, so the diagram suggests room and free movement that are not there.
Part 4 · Testing a competing explanation, and revising
Before accepting an explanation, write down a rival. If the covered soil lost less water, the rival might be that the covered container started with less water, or was cooler, or was smaller in surface area to begin with. Each rival suggests a check: weigh the starting water, record both temperatures, measure both surfaces. Working through rivals is what separates a conclusion from a first impression.
Then be specific about what the evidence can carry. The covered sample still lost 5 g, so a claim that a cover prevents all evaporation is contradicted by the investigator's own data — a surprisingly common kind of error, where the claim is stronger than the result the person just wrote down. "Reduced by 7 g under these conditions" is supported; "prevents" is not.
Revision is the normal end of this process, not a failure of it. A claim narrowed to the conditions it was tested under, with its mechanism stated and its main rival addressed, is a better piece of work than a bold claim with the same data behind it. The habit to build is writing the limitation yourself, before anyone else has to point it out.
Pause and explain
The covered soil still lost 5 g. What does that rule out?
Check your reasoning after answering
It rules out any claim that the cover prevents evaporation entirely, since the covered sample demonstrably lost water. The supported claim is that the cover was associated with 7 g less loss than the uncovered sample under these conditions — a reduction, not a prevention, and one measured over a single stated interval.
Apply the whole unit · Evaluate an explanation
Illustrative observation, not a measured experiment: covered soil loses 5 g of water over a day, while uncovered soil loses 12 g in the same setting. Starting water, container and temperature are stated to be comparable. A draft claim says that a cover always prevents all evaporation.
Your task
Write a better claim, cite the numerical evidence, explain a plausible mechanism, and identify a limit on what the record supports.
What your response should show
- Explain the relevant biological process accurately.
- Use the supplied evidence and show calculation steps with units where needed.
- Connect a labeled model or mechanism with the claim.
- State an assumption, evidence limitation, or useful next observation.
Response guidance — after your attempt
Calculate the difference the record shows: 12 − 5 = 7 g less water lost from the covered sample over the stated day.
Correct the claim against the investigator's own data: the covered sample lost 5 g, so "prevents all evaporation" is contradicted; the supported word is reduced.
Supply the mechanism: water leaves as vapour from the exposed surface, and a cover reduces that exposed area and traps humid air above the soil, so fewer molecules escape per unit time.
Name a limit and a rival worth checking: one comparison over one day in one setting, and the record does not confirm that the two containers had identical surface areas or air movement.
A better claim is that covering the soil was associated with 7 g less water loss over a day under these conditions — 12 g uncovered against 5 g covered — rather than that a cover prevents evaporation. The investigator's own figure refutes the stronger wording, because the covered sample still lost 5 g. The mechanism that would explain the reduction is straightforward: water leaves soil as vapour from the exposed surface, and the rate depends on how much surface is exposed, how dry the air above it is, and how fast that air is replaced. A cover reduces the exposed area and holds a layer of humid air in place, so fewer molecules escape per minute, and the loss that remains can happen at the edges or through the cover itself. That mechanism makes testable predictions: a perforated cover should fall between the two, a draught should widen the gap, and a wider container should lose more. The limits are worth stating plainly. This is one comparison over one day in one setting, so it does not establish how the effect would scale with time, temperature or wind. The record states that starting water, container and temperature were comparable, but not that the exposed surface areas were equal, and a difference there would be a rival explanation for part of the 7 g.
Scientific references for this unit
Parent / teacher teaching notes
Ask for a because-statement and a labeled relationship, not just a memorized word. Work through one calculation step at a time, permit oral or diagram responses, and use flexible sessions for difficult reading. Compare the learner’s actual evidence with the supplied model; do not reward copying or agreement with a personal preference. No private family, genetic, or medical records are required.
The key idea
A scientific explanation connects a claim with evidence and reasoning. The claim answers the question; the evidence consists of relevant observations or measurements; reasoning explains why a scientific idea connects that evidence to the claim. Restating a claim in different words is not enough. An explanation should also identify what the evidence does not settle.
Worked examples
Example 1 · Rebuild a weak explanation
- State the claim precisely, with the comparison and the conditions: seedlings 20 cm from a window gained more height over fourteen days than matched seedlings 2 m away.
- Attach the evidence with numbers: the near group averaged 9.2 cm (range 2 cm, ten plants), the far group 3.1 cm (range 3 cm, ten plants).
- Supply the mechanism rather than restating: chlorophyll in the chloroplasts absorbs light energy, which drives photosynthesis and builds the glucose used to make new cells, so more light available means more material for growth up to a limit.
"Because it is good for them" has a because in it and no mechanism. Mechanism is the test.
Example 2 · Find the rival explanation
- Ask what else could produce less measured loss besides reduced evaporation.
- Rival one: the pots did not start with the same amount of water, so the covered one had less to lose. Check by weighing both at the start and recording the figures.
- Rival two: the pots were not in matched positions, so the covered one was cooler or more sheltered. Check by recording temperature and air movement at both positions, or by swapping them and repeating.
Write the rival down before you write the conclusion, not after someone objects.
Avoid these mistakes
- Mistake: reasoning means saying because. "The cover reduced loss because less was lost" restates the evidence; reasoning names the mechanism — reduced exposed surface and trapped humid air.
- Mistake: a claim can be stronger than the data. The covered soil still lost 5 g, so the investigator's own record refutes "prevents all evaporation"; reduced by 7 g is what is supported.
- Mistake: a model is wrong if it is incomplete. Every model leaves things out on purpose; judge it by whether it is adequate for the question, and name its main limitation.
- Mistake: an observation and an inference are the same kind of statement. "Lost 12 g" can be rechecked by repeating the weighing; "covering reduces evaporation" is an argument about what the measurement means.
Check your understanding
Which part of “the soil is wet because it rained” is an inference?
Discuss the answer
The proposed rainfall cause is an inference; wet soil is the stated observation. Watering or another source could also explain it.
How is reasoning different from listing numbers?
Discuss the answer
Reasoning explains a scientific connection between the observations and the claim. Numbers become relevant evidence through that connection.
Words to know
- claim
- The statement being asserted — what you think is true — stated precisely enough that evidence could contradict it.
- evidence
- The specific observations and measurements supporting a claim, given with numbers and units.
- reasoning
- The connection between evidence and claim, usually a mechanism explaining how one would produce the other; restating the evidence is not reasoning.
- model
- A deliberate simplification used to think with, judged by whether it is adequate for the question rather than whether it is complete.
- limitation
- A respect in which a model or an investigation does not match reality; a good statement names its own.
Extend your scientific explanation
Compare a second supplied example or the linked educational reference. Identify a connection, a model limit, and an additional observation that would test the explanation.
In the real world
Use a clear question, reliable observations, and a biological mechanism to evaluate a claim. State what remains uncertain before applying a classroom model to a different setting.
Exit check
Does naming a limitation make an explanation worthless?
Check your explanation after answering
No. It makes the conclusion more accurate and identifies what further evidence would strengthen or change it.
Explain your reasoning without notes. If a key idea is missing, revisit the lesson and try again.
Characteristics of Life & Biological Diversity
Learning goals
- I can explain characteristics of life & biological diversity.
- I can use evidence, a model, and stated assumptions to support a biological explanation.
Before this unit
Use the supplied vocabulary, distinguish an observation from an explanation, and identify any units or model assumptions. Revisit a connected earlier unit if needed; new terms are explained here.
Use three flexible 40–45-minute sessions: core background and Parts 1–2 with their checks; Parts 3–4 and the worked application; then remaining practice, a labeled model, revision, and the exit check. Checks completed during reading can count toward the practice set. Read one short part at a time. Investigations and chapter review/quiz have separate sessions, and flexible weeks allow more time.
In 2005 a seed that had sat in a desert fortress at Masada for roughly two thousand years was planted, watered, and grew into a date palm. For twenty centuries it did nothing measurable: it did not move, grow, feed, or respond. Was it alive the whole time? Now hold that question next to a few others. A fire grows, consumes fuel, releases heat and spreads to new ground. A salt crystal in a saturated solution grows and takes on a regular form. A wind-up toy moves on its own. None of those is alive, and each one does something people instinctively associate with life. That is the problem this unit solves: no single characteristic separates the living from the non-living, and the question has to be answered with several at once.
The working definition uses a set. An organism is made of one or more cells; it takes in materials and uses energy; it responds to its surroundings; it grows and develops; it reproduces; and it maintains stable internal conditions. That last one is homeostasis, and it is the characteristic the fire and the crystal most clearly fail — a fire does not regulate its own temperature, it simply burns until the fuel runs out. The characteristics are applied together, and with an allowance for state: a dormant seed is not carrying them out at this moment but has the cellular organisation to do so, and the Masada seed proved it.
Organising the variety that results is classification, and the deepest division is one you have already met. Prokaryotic cells keep their DNA loose in the cytoplasm with no enclosed nucleus; bacteria are the familiar example, and they are by far the most numerous organisms on Earth. Eukaryotic cells keep their DNA in a nucleus, and that group covers animals, plants, fungi and the single-celled protists. Modern classification sorts organisms by shared ancestry, which is why a mushroom turns out to be more closely related to you than to a plant. One warning before the detail: the resulting tree is not a ladder from simple to advanced. Bacteria are not failed attempts at being complicated — they are superbly successful organisms that have been adapting for as long as everything else.
Build your understanding
Where this fits
Chapter 1 has been about method: designing a comparison, measuring it, summarising it, and arguing from it. This unit turns those tools on the first real question of the course — what counts as living, and how the enormous variety of living things can be organised. It also sets up Chapter 2, which asks what living things are built from.
Use three flexible 40–45-minute sessions: core background and Parts 1–2 with their checks; Parts 3–4 and the worked application; then remaining practice, a labeled model, revision, and the exit check. Checks completed during reading can count toward the practice set. Read one short part at a time. Investigations and chapter review/quiz have separate sessions, and flexible weeks allow more time.
Part 1 · Using several characteristics together
Take the characteristics one at a time against the awkward cases and you see why the set is needed. Growth: crystals grow, by adding material to the outside, while organisms grow by building new material inside cells and by making more cells. Movement: a toy moves, and most plants do not move about at all, so movement is neither necessary nor sufficient. Using energy: a fire does, spectacularly, and it does not regulate anything or reproduce in the biological sense.
Reproduction is the one most often misapplied. A fire spreading to the next field looks like reproduction and is not — no inherited information passes, and nothing about the new fire is determined by the old one. A mule is alive and cannot reproduce. So reproduction is a characteristic of life in general, applied to kinds of organism, not a test you can run on an individual.
Cellular organisation is the characteristic that does most of the work, which is why Chapter 2 spends five units on it. Everything we accept as living is made of cells, and no fire or crystal is. Even so, apply the set rather than the single test — viruses, which have genetic material and a protein coat but no cells and no metabolism of their own, sit on the boundary and biologists genuinely disagree about which side.
Pause and explain
A fire grows, uses fuel, releases energy and spreads. Why is it not alive?
Check your reasoning after answering
Because it fails most of the set. It is not made of cells, it does not maintain stable internal conditions, and its spread transmits no inherited information — the next fire is not built from instructions carried by the first. It satisfies growth and energy use, which is exactly why several characteristics have to be applied together rather than one.
Part 2 · A need is not the same as one way of meeting it
Every organism needs energy, materials, water and a way of dealing with waste. The mistake is to take the familiar solution to one of those needs and treat it as the need itself. Animals meet the energy requirement by eating other organisms; plants meet it by building their own glucose from light; some bacteria meet it by oxidising chemicals in rock, with no light involved at all. All three are feeding in the biological sense.
The same applies to gas exchange and to movement. You take in oxygen through lungs, a fish through gills, an insect through tubes that carry air directly to its tissues, and a plant through pores in its leaves. Lungs are a solution, not a requirement. Asking "how does this organism meet the need?" instead of "does it have the organ I know?" is what lets you reason about an unfamiliar one.
Homeostasis works the same way. You keep your temperature near 37 degrees by sweating, shivering and adjusting blood flow; a lizard does it by moving between sun and shade; a bacterium does not regulate its temperature at all but regulates its internal chemistry carefully. Different mechanisms, the same requirement — stable enough internal conditions for the chemistry of life to continue.
Pause and explain
A bacterium in a deep rock has no light and eats no other organism. How can it be alive?
Check your reasoning after answering
Because feeding means obtaining energy and materials, not eating in the familiar sense. Some bacteria obtain energy by driving chemical reactions with compounds in rock or water, building what they need from simple molecules. The need is energy and raw material; eating other organisms and photosynthesis are two solutions among several.
Part 3 · Classifying cells and organisms from evidence
The prokaryote–eukaryote division rests on one observable feature with large consequences: whether the DNA is enclosed in a nucleus. Prokaryotic cells are generally small, from about 1 to 5 micrometres, with no membrane-bound organelles. Eukaryotic cells are typically ten to a hundred times larger in volume, with a nucleus and the organelles from Chapter 2 — and that internal compartmentation is what allows the division of labour that multicellular life depends on.
To classify something you need more than one observation, and you need to know what each one can establish. A cell with a wall could be a plant, a fungus or a bacterium, since all three build walls out of different materials. A green cell is probably photosynthetic but could be coloured another way. A cell with no visible nucleus under a light microscope might be prokaryotic, or might be a eukaryotic cell whose nucleus is out of the plane of focus, or a mature red blood cell that discarded one.
So a careful classification states which features it used and what it has not ruled out. "This is a prokaryote, on the evidence that DNA is present without an enclosing membrane in the electron micrograph, and that the cell is about 2 micrometres long" is a conclusion somebody can check. "It looks like a bacterium" is a hunch.
Pause and explain
Why is "no nucleus visible" weaker evidence for a prokaryote than "DNA present with no enclosing membrane"?
Check your reasoning after answering
Because invisibility has several causes. Under a light microscope a nucleus may simply be out of focus, unstained, or below the resolution of the instrument, and a mature mammalian red blood cell is eukaryotic with no nucleus at all. Observing DNA with no membrane around it, which needs an electron micrograph, establishes the defining feature directly rather than inferring it from an absence.
Part 4 · Organising diversity without building a ladder
Classification today groups organisms by shared ancestry, so the categories are meant to reflect history rather than resemblance. That produces results that surprise people. Fungi are more closely related to animals than to plants. Birds sit inside the group that contains the dinosaurs. A dolphin is closer kin to a cow than to a shark, despite looking far more like the shark, because similar bodies can evolve independently in similar conditions.
The picture to resist is the ladder — bacteria at the bottom, humans at the top, everything else arranged by how advanced it is. Every organism alive today has exactly the same length of ancestry behind it, and each is adapted to its own circumstances. Bacteria outnumber everything, inhabit places nothing else can, and have been evolving for the whole history of life. Simpler in structure is not earlier in time or worse at living.
The honest shape is a branching tree, where the question is not how high something sits but where its line split from another. That framing matters for the last chapter of this course, which is about the evidence for those splits, and it matters here because the shape of the diagram quietly teaches an idea whether or not anyone says it aloud.
Pause and explain
Why is it wrong to call bacteria the most primitive organisms alive?
Check your reasoning after answering
Because every living organism has the same length of evolutionary history behind it — bacteria alive now are not ancestors of anything alive now. They are simpler in cell structure and superbly adapted, occupying more habitats than any other group. Primitive confuses simple structure with being early in time, which the branching tree of shared ancestry does not support.
Apply the whole unit · Compare three records
Illustrative records, not real specimens: A is a seed made of cells, dormant at the time of observation, which later germinates. B is a battery-powered toy that moves across a table. C is a cell about 2 micrometres long with a membrane and DNA, but no enclosing membrane around that DNA.
Your task
Use several characteristics to decide the living status of each, and explain why movement alone and the presence of a nucleus alone are not sufficient tests.
What your response should show
- Explain the relevant biological process accurately.
- Use the supplied evidence and show calculation steps with units where needed.
- Connect a labeled model or mechanism with the claim.
- State an assumption, evidence limitation, or useful next observation.
Response guidance — after your attempt
Apply the set to A: made of cells, with the organisation to grow, use energy and reproduce, which germination later demonstrates — dormancy is a state, not evidence against life.
Apply the set to B: it moves and uses stored energy, and it is not made of cells, does not grow, does not reproduce and regulates nothing, so it fails nearly every characteristic.
Apply the set to C: it is a cell with a membrane and DNA, so it is an organism; the absence of an enclosing membrane around the DNA classifies it as prokaryotic rather than placing it outside life.
State why single tests fail: movement is shown by B and absent in most plants, and a nucleus is absent in every bacterium and in mature mammalian red blood cells.
A and C are living under these records; B is not. A is made of cells and carries the organisation needed to grow, use energy and reproduce, and its later germination demonstrates that directly — dormancy is a state an organism can be in, not evidence against being one, as a date palm grown in 2005 from a two-thousand-year-old seed showed. C is a cell with a membrane and its own DNA, which makes it an organism; the fact that the DNA is not enclosed in a nucleus is a classification result, placing it among the prokaryotes, and not a reason to exclude it. Bacteria are enormously successful organisms and the most numerous on Earth. B moves and draws on stored energy, and that is all: it is not made of cells, does not grow or develop, does not reproduce, and maintains no internal conditions. The two tempting single tests both fail. Movement is shown by B, which is not alive, and is largely absent in plants, which are. A nucleus is absent in every prokaryote and in mature mammalian red blood cells, so its absence classifies rather than disqualifies. The records also leave things open: they do not say whether A's cells were still carrying out any measurable metabolism while dormant, and for C they report structure without reporting reproduction, which would be the direct evidence.
Scientific references for this unit
Parent / teacher teaching notes
Ask for a because-statement and a labeled relationship, not just a memorized word. Work through one calculation step at a time, permit oral or diagram responses, and use flexible sessions for difficult reading. Compare the learner’s actual evidence with the supplied model; do not reward copying or agreement with a personal preference. No private family, genetic, or medical records are required.
The key idea
Living organisms are organized into cells and carry out interacting processes such as using matter and energy, responding to conditions, maintaining internal conditions, growing, and producing new organisms across their life cycle. No single visible action is a complete definition. A moving toy is not alive because it moves, and a dormant seed does not become nonliving simply because it currently shows little visible activity.
Worked examples
Example 1 · Decide a hard case
- Apply the characteristics one by one: it carries genetic material and can be replicated, but it is not made of cells, uses no energy of its own, and regulates nothing.
- Identify which failures are decisive: having no cells and no metabolism of its own are the two that matter most, since reproduction happens only by commandeering a host.
- State the position honestly: most biologists place viruses outside the definition, while noting that they evolve and carry inherited information, so the boundary is genuinely disputed.
A good answer here names which characteristics fail, not just the verdict.
Example 2 · Classify from two observations
- Use the defining feature: DNA present without an enclosing membrane makes the cell prokaryotic.
- Check the supporting observation: 3 micrometres is within the usual prokaryotic range, and the absence of membrane-bound organelles is consistent.
- State the open questions: the micrograph shows structure at one instant, not how the cell obtains energy, what it does, or which group of prokaryotes it belongs to.
Say what the evidence settles and what it leaves open; both belong in the answer.
Avoid these mistakes
- Mistake: movement shows something is alive. A battery toy moves and is not alive; most plants do not move about and are. Movement is neither necessary nor sufficient.
- Mistake: a dormant seed is not alive. The Masada date palm seed germinated after roughly two thousand years — dormancy is a state an organism can be in, not a failure of the characteristics.
- Mistake: no nucleus means not a cell. Every bacterium lacks one and is fully alive, and mature mammalian red blood cells discard theirs; absence of a nucleus classifies rather than disqualifies.
- Mistake: classification ranks organisms from primitive to advanced. Every organism alive today has the same length of ancestry behind it; the honest shape is a branching tree, not a ladder.
Check your understanding
Why does movement alone not establish life?
Discuss the answer
Nonliving objects can move through motors, wind, or gravity. Cellular organization and interacting life processes provide stronger evidence.
Why is “all living things eat other organisms” incorrect?
Discuss the answer
Photosynthetic organisms can build sugars using inorganic inputs and light. Organisms differ in how they obtain food and energy.
Words to know
- organism
- A living thing made of one or more cells that uses energy, responds, grows, reproduces and maintains stable internal conditions — characteristics applied as a set.
- homeostasis
- Keeping internal conditions stable enough for the chemistry of life to continue; the characteristic a fire or a crystal most clearly lacks.
- prokaryotic
- Having DNA loose in the cytoplasm with no enclosing nucleus, as bacteria do; typically 1 to 5 micrometres long.
- eukaryotic
- Having DNA enclosed in a nucleus, with membrane-bound organelles; animals, plants, fungi and protists.
- classification
- Organising organisms by shared ancestry, producing a branching tree rather than a ladder from simple to advanced.
Extend your scientific explanation
Compare a second supplied example or the linked educational reference. Identify a connection, a model limit, and an additional observation that would test the explanation.
In the real world
Use a clear question, reliable observations, and a biological mechanism to evaluate a claim. State what remains uncertain before applying a classroom model to a different setting.
Exit check
Does a classification key by itself show ancestry?
Check your explanation after answering
Not necessarily. It identifies using chosen features; an ancestry claim requires evidence supporting inherited relationships.
Explain your reasoning without notes. If a key idea is missing, revisit the lesson and try again.
Problem 1
Answer and explanation
The record shows a 3 cm difference in height gain, but both water and light differ. It cannot isolate water’s effect. A revised comparison would keep light, species, starting conditions, and times comparable while changing only the defined water treatment; independent seedlings and recorded variation would strengthen the evidence.
Identify water amount as the intended factor.
Measure height change in centimeters over seven days.
Recognize light as an additional changed factor.
Match light and other conditions, then use several seedlings per group.
Response criteria
- Explain the relevant biological process accurately.
- Use the supplied evidence and show calculation steps with units where needed.
- Connect a labeled model or mechanism with the claim.
- State an assumption, evidence limitation, or useful next observation.
Problem 2
Answer and explanation
It keeps the comparison consistent and reduces the temptation to choose whichever observation later supports a favorite explanation.
Problem 3
Answer and explanation
The cell length is approximately 60 micrometers, and the stated total magnification is 400×. Length describes the specimen estimate; magnification describes image enlargement. Both assume the provided record is correct, and the scale calculation assumes uniform resizing of the cell and bar. Magnification alone does not supply the real cell length.
Find the ratio 1.2/4=0.3.
Multiply 0.3 by 200 micrometers.
Multiply lens factors 10×40.
Check that image and scale bar were resized together.
Response criteria
- Explain the relevant biological process accurately.
- Use the supplied evidence and show calculation steps with units where needed.
- Connect a labeled model or mechanism with the claim.
- State an assumption, evidence limitation, or useful next observation.
Problem 4
Answer and explanation
It omits the unit and measurement method. A cell might be 20 micrometers long, but the number alone cannot establish its size.
Problem 5
Answer and explanation
Both means are 4 cm. A’s numerical range is 2 cm; B’s is 6 cm. The means agree but B’s observations are more spread out. These small illustrative sets do not establish why variability differs or whether a treatment caused the pattern. Keep individual records, examine methods, and use more independent observations.
A sum is 12 cm and B sum is 12 cm.
Divide each by three.
Subtract smallest from largest in each set.
Compare spread without inventing a cause.
Response criteria
- Explain the relevant biological process accurately.
- Use the supplied evidence and show calculation steps with units where needed.
- Connect a labeled model or mechanism with the claim.
- State an assumption, evidence limitation, or useful next observation.
Problem 6
Answer and explanation
Missing means no valid observation was recorded. Zero claims that the measured quantity was actually zero.
Problem 7
Answer and explanation
The cover is associated with 7 g less measured water loss in this comparison. Reducing exposed soil can reduce evaporation under comparable conditions, but the covered sample still lost 5 g. The record therefore does not support “all evaporation prevented” or “always.” Repeated matched trials and checks for other loss pathways would strengthen the explanation.
Calculate the measured loss difference: 12−5=7 g.
State reduced loss in the observed setting.
Connect the cover with reduced exposure under the model.
Notice that 5 g was still lost and other settings were not tested.
Response criteria
- Explain the relevant biological process accurately.
- Use the supplied evidence and show calculation steps with units where needed.
- Connect a labeled model or mechanism with the claim.
- State an assumption, evidence limitation, or useful next observation.
Problem 8
Answer and explanation
The proposed rainfall cause is an inference; wet soil is the stated observation. Watering or another source could also explain it.
Problem 9
Answer and explanation
A and C are living under the supplied records. A’s cellular organization and germination support that conclusion despite its earlier dormancy. C can function without an enclosed nucleus because it is prokaryotic. B’s movement alone does not establish cellular life. The comparison relies on the supplied biological observations, not a rule that every moving object is alive.
Identify cellular organization in A and C.
Use germination as evidence of a seed’s life process.
Separate powered toy motion from cellular activity.
Recognize C as a prokaryotic organism.
Response criteria
- Explain the relevant biological process accurately.
- Use the supplied evidence and show calculation steps with units where needed.
- Connect a labeled model or mechanism with the claim.
- State an assumption, evidence limitation, or useful next observation.
Problem 10
Answer and explanation
Nonliving objects can move through motors, wind, or gravity. Cellular organization and interacting life processes provide stronger evidence.