Biodiversity Loss — Practice · Grade 12 Science
Chapter: Conservation, Systems & Environmental DesignWhat this practice covers
By the end of Biodiversity Loss you should be able to:
- I can define biodiversity and explain why it matters to ecosystems and to people.
- I can identify the major human-caused drivers of biodiversity loss.
- I can explain why the current rate of extinction concerns scientists.
10 questions, multiple choice, numeric and written answer, each with a worked explanation.
Vocabulary used: biodiversity, extinction, habitat fragmentation, invasive species, ecosystem services.
Problem 1
- Scientists collecting a few specimens for study
- Natural predators hunting their usual prey
- Zoos keeping some animals in captivity
- Habitat loss and fragmentation from clearing and dividing land
Answer and explanation
Habitat loss and fragmentation from clearing and dividing land
Clearing and dividing land can reduce available habitat and connectivity. The relative importance of threats varies among ecosystems and requires evidence.
Problem 2
- a non-native species that spreads rapidly in a new area and harms native species
- any large predator at the top of a food chain
- a native species that has lived in an ecosystem for thousands of years
- any species that is currently close to extinction
Answer and explanation
a non-native species that spreads rapidly in a new area and harms native species
Invasive species are non-natives that, lacking natural predators or competitors in the new range, spread out of control and damage native populations.
Problem 3
Answer and explanation
85 %
Area lost = 500 - 75 = 425 hectares; 425 ÷ 500 = 0.85, or 85% of the wetland lost.
Problem 4
Answer and explanation
Examples include pollination of crops by insects, filtering and cleaning of water by wetlands and forests, fertile soil built by soil organisms, flood control, and climate regulation. These services depend on many interacting species; as biodiversity declines, the organisms that perform them are lost and the services weaken or fail, directly harming the food, water, and protection people rely on.
Problem 5
- Because a higher extinction rate must mean the number of species is increasing
- Because extinctions at this pace outrun the rate at which evolution produces new species, so total biodiversity is falling and lost species can never be recovered
- Because faster extinction means new species also appear faster, keeping biodiversity constant
- Because extinction has never happened before in Earth's history
Answer and explanation
Because extinctions at this pace outrun the rate at which evolution produces new species, so total biodiversity is falling and lost species can never be recovered
Extinction is permanent, and losing species far faster than new ones evolve means biodiversity is steadily and irreversibly declining.
Problem 6
Hints
Absence of detection is not proof of absence.
Answer and explanation
It can restrict movement, gene flow and access to resources and increase edge effects.
Problem 7
Hints
State what the supplied observations or conditions establish, and separate that from any assumption.
Answer and explanation
Comparable abundance, reproduction, habitat or functional measures with methods, baseline and uncertainty disclosed.
Problem 8
Answer and explanation
Survey area, method, effort, timing, observer/detection conditions and relevant uncertainty.
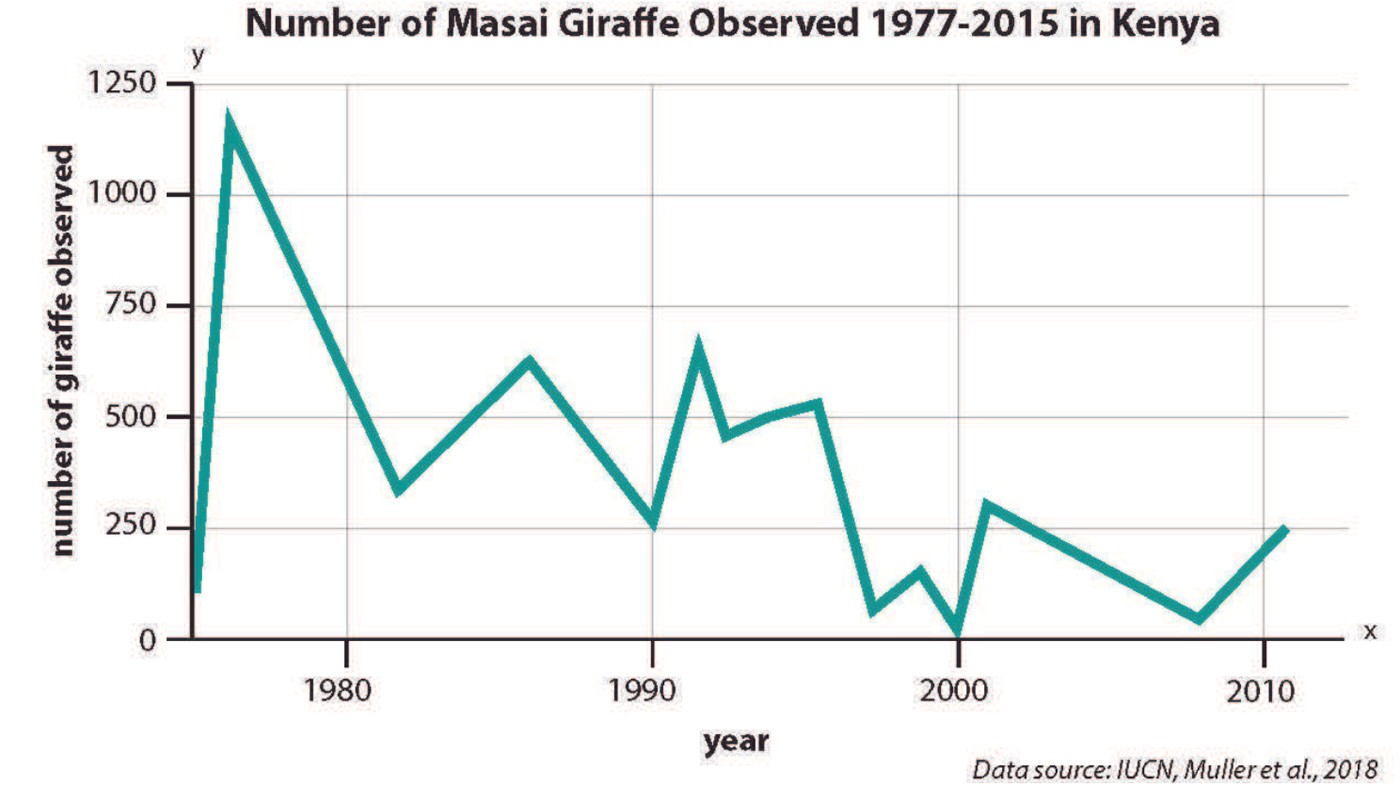
Observed abundance depends on true population, sampled extent, effort and detectability. A declining count may signal ecological loss, but an observation model is needed to separate that from reduced survey effort or changed visibility. The two hypothetical curves are reminders of this ambiguity, not proof that any particular real decline is only a measurement artifact. Preserve all source labels and compare repeated standardized monitoring or an appropriate detection-adjusted analysis.
Survey area, method, effort, timing, observer/detection conditions and relevant uncertainty.
Response criteria
- Interpret labels, structures, axes, units and directions correctly.
- Explain the physical or environmental relationship or mechanism.
- Respect stated assumptions and distinguish observation from inference.
Problem 9
Answer and explanation
Decline=(500−350)/500=30%. Living individuals remain in the defined population, and the record alone cannot distinguish survival, reproduction, movement or the pressures affecting them.
Decline=(500−350)/500=30%.
Living individuals remain in the defined population, and the record alone cannot distinguish survival, reproduction, movement or the pressures affecting them.
Response criteria
- Use the stated measurements or conditions, with correct units.
- Connect the result to the physical or environmental mechanism or evidence relationship.
- Identify the assumption, model limit or further evidence requested.
Problem 10
Answer and explanation
The displayed observed counts fluctuate, with an early high peak and many lower later counts. It is a Kenya-scoped observed-count graph, not a global census. Search effort, coverage, detection and demographic/pressure evidence are needed to interpret actual abundance and causes. The title’s interval must not be used to fabricate unplotted exact annual values.
Read source labels, scope, axes and intentional omissions.
Use the complete local explanation to draw a justified mechanism or calculate a supported quantity.
State what is observed, what is assumed and what evidence remains needed.
Response criteria
- Interpret the source labels, units and scope accurately.
- Explain the relevant mechanism with a labeled model or supported calculation.
- Identify a meaningful assumption, uncertainty or missing comparison.