Biodiversity Evidence & Conservation Design — Print · Grade 10 Science
Chapter: Ecosystems & Conservation DecisionsBiodiversity Evidence & Conservation Design
Learning goals
- I can compare biodiversity using standardized sampling and more than one measure.
- I can evaluate a conservation proposal against criteria, constraints, and tradeoffs.
Readings for this unit
Before this unit
Calculate sample proportions and identify a fair comparison.
Use three flexible study sessions: core explanation and Parts 1–2; Parts 3–4 with their reasoning checks and models; then the whole-unit application, worked examples, independent practice, and exit check. Allow about 50–60 minutes per session, including diagrams, data work, and notebook explanations. Attempt each check before opening its guidance. Schedule chapter investigations, review, and exams separately; add time where prerequisites are uncertain. Trace the explained visual parts and write a first model, then attempt the illustrated and changed independent cases. In the third session explain a correction and revise the opening account using evidence.
Start with something to explain
How can equal-area designs have different conservation outcomes?
Illustrative evidence case. Shape, boundary exposure, connections and the matched threat influence whether organisms can use habitat.
Notice and wonder
Record two observations using the stated quantities or relationships. Keep observations separate from possible causes. Write one question that a new measurement could help answer.
How can equal-area designs have different conservation outcomes?
Your first model
State goals, constraints, dimensions, indicators and a revision criterion.
Build the language from the idea
- species richness
- The number of species recorded in a defined sample.
- evenness
- How equally abundance is distributed across sampled species.
- constraint
- A limit a proposed design must satisfy.
Species richness counts species observed; evenness describes how individuals are distributed among them. Two samples can have equal richness but different evenness. Standardize sampling area, effort, season, and methods before comparing sites. An observed count is not a complete census of every organism present.
Conservation decisions combine biological evidence with goals and constraints. A project may protect habitat, reduce pollution, connect isolated patches, or manage harvest. Define success quantitatively, consider effects on people and other species, and compare alternatives. A connected corridor may help some organisms move but can have context-dependent costs.
Test a design with monitoring before and after implementation and suitable comparison sites where possible. A change after an intervention may also reflect weather, sampling, or other causes. Revisit the design using evidence, acknowledge uncertainty, and explain which tradeoffs justify the choice.
A biodiversity survey needs a defined area, sampling method and effort. Detection varies among species and conditions, so absence from a small sample does not establish true absence. Repeat and compare equivalent effort before interpreting site differences.
Design solutions from evidence about the threat. A corridor may address isolation, while runoff control addresses pollutant inputs. One solution rarely fixes every problem. Use criteria such as habitat quality, connectivity, feasibility and effects on nearby communities.
A proposal should predict measurable outcomes and state when monitoring occurs. If the result differs, examine the mechanism, sampling and new conditions before redesigning. Scientific revision turns a promising idea into an evaluated intervention rather than a claim based on intention alone.
Build your understanding
Use three flexible study sessions: core explanation and Parts 1–2; Parts 3–4 with their reasoning checks and models; then the whole-unit application, worked examples, independent practice, and exit check. Allow about 50–60 minutes per session, including diagrams, data work, and notebook explanations. Attempt each check before opening its guidance. Schedule chapter investigations, review, and exams separately; add time where prerequisites are uncertain.
Part 1 · A decision needs a stated objective
A design objective states what improvement is sought and how evidence will assess it. Quantitative measures can make comparison clear, but qualitative criteria can also be useful when systematically defined and evaluated. Constraints include resources, access, maintenance or other limits. Choose indicators that match the purpose rather than a convenient count unrelated to the threat. State the population, location, interval and affected groups so a proposal can be inspected and revised rather than declared successful by a vague word such as better.
Read the visual model
Identify the labeled structures and units, then trace the arrows or compare values under the caption’s stated conditions. Separate the displayed evidence from a further inference. Write your reasoning before opening the guidance.
Must every conservation objective be only a single quantitative score?
Visual reasoning — after your attempt
No. It must be assessable; well-defined qualitative criteria and multiple quantitative indicators can both contribute.
Conservation design begins with what is being conserved and to what standard — a particular species' breeding population, the area of a habitat type, the connectivity of a landscape, or the functioning of a process such as pollination. Different objectives point to different designs, so an unstated objective makes a plan impossible to evaluate.
The objective must also be measurable. "Protect biodiversity" cannot be assessed; "maintain at least 60 breeding pairs across the reserve network, measured by annual survey at constant effort" can. Making the objective quantitative is what allows anyone, later, to tell whether the plan succeeded.
Pause and explain
Why must a conservation objective specify how its outcome will be evaluated? Does every useful criterion have to be one numerical score?
Check your reasoning after answering
An assessable objective supports transparent comparison, monitoring and revision. Quantitative measures help, while clearly defined qualitative criteria and multiple indicators can also be useful.
Part 2 · Size, shape, and connection
A perimeter measures boundary length, while area measures enclosed space. The supplied 150×150 m square and 300×75 m rectangle each enclose 22,500 m², but their perimeters are 600 and 750 m. Edge exposure can change microclimate, access and interactions; it is not universally harmful or beneficial to every species. A narrow patch can also be useful as a corridor. Compare habitat quality, dispersal and goals rather than deciding design only from area or a simple shape preference.
Read the visual model
Identify the labeled structures and units, then trace the arrows or compare values under the caption’s stated conditions. Separate the displayed evidence from a further inference. Write your reasoning before opening the guidance.
Why might equal area fail to provide equal usable core habitat?
Visual reasoning — after your attempt
Different perimeter/width and edge conditions can alter the interior habitat available to a particular organism.
Three design properties recur. Area determines how large a population can be supported, and larger populations are less vulnerable to chance extinction and to loss of variation. Shape determines the ratio of edge to interior, and compact areas preserve more interior conditions than long thin ones of the same area. Connection determines whether individuals can move between patches, maintaining gene flow and allowing recolonization.
These properties trade off against cost and against each other, and against the risk of a single catastrophe affecting one large reserve. There is no universally correct configuration: the right design depends on the species' area requirements and mobility, the threats expected, and what land is actually available. Stating those dependencies is part of the design rather than an afterthought.
Pause and explain
Two reserves have equal area but one is long and narrow. Why might it conserve less?
Check your reasoning after answering
A long narrow reserve has far more edge relative to its interior, so a larger proportion is exposed to outside conditions, disturbance, and invading species. Species requiring interior conditions have less usable habitat than the total area suggests.
Part 3 · Indicators and monitoring
A monitoring criterion states what result would support progress, reveal failure or trigger revision. Reference sites help distinguish intervention effects from broader changes, though they need comparable conditions and sampling. A before–after difference can be misleading when weather, detection or other pressures also change. Record methods, repeated observations and uncertainty before selecting favorable outcomes. A project’s activity count, such as materials installed, is not automatically evidence that the desired ecological mechanism occurred.
Read the visual model
Identify the labeled structures and units, then trace the arrows or compare values under the caption’s stated conditions. Separate the displayed evidence from a further inference. Write your reasoning before opening the guidance.
Why should failure/revision criteria be written before the outcome is known?
Visual reasoning — after your attempt
This limits selecting only favorable measures afterward and makes the evaluation transparent and testable.
A plan needs an indicator that can be measured consistently: a population count at fixed effort, the area of a habitat type from imagery, the presence of a species sensitive to the conditions of concern. The indicator should respond to what the plan is trying to change, and it must be measured the same way before and after, since a change in method produces a change in the number regardless of what happened in the field.
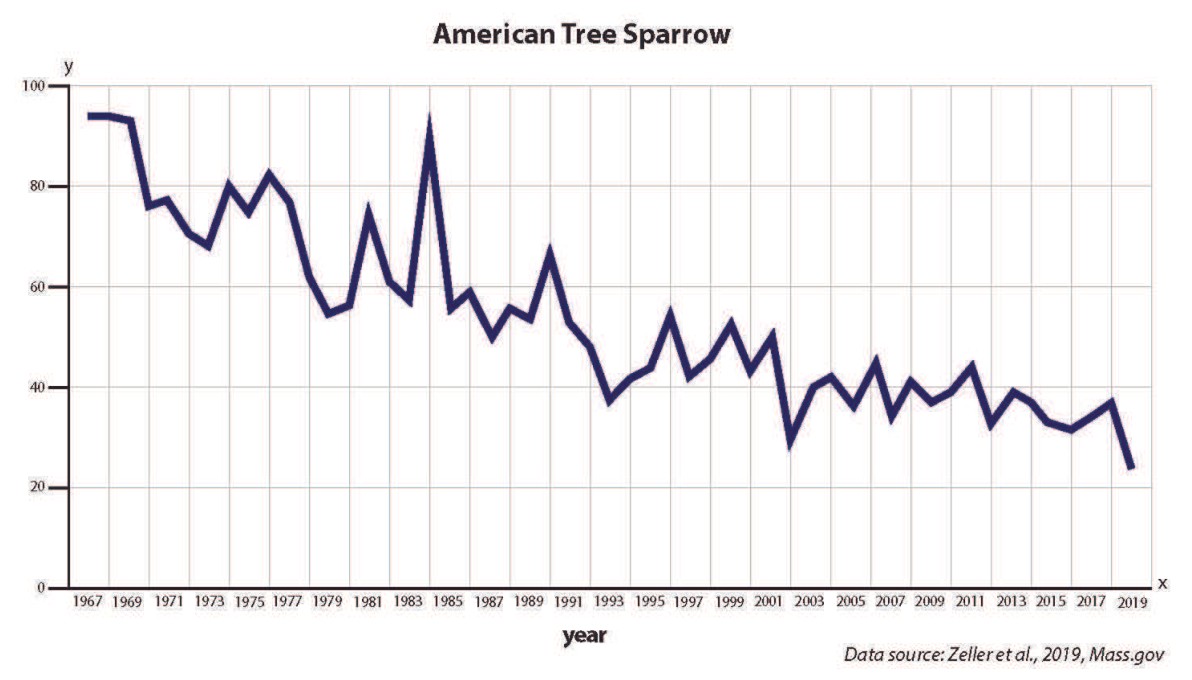
Monitoring also needs a schedule and a decision rule stated in advance — what will be measured, how often, and what result will trigger a change of approach. Without a rule set beforehand, results tend to be interpreted favourably after the fact, and a plan can continue for years without anyone establishing whether it works.
Pause and explain
Why should the result that would count as failure be stated before monitoring begins?
Check your reasoning after answering
Stating it in advance prevents the outcome from being reinterpreted as success after the fact, and it commits the plan to a change of approach if the target is not met. A rule set afterwards can be adjusted to whatever the data show.
Part 4 · Cost, uncertainty, and who decides
A tradeoff is a comparison among outcomes that may not improve together. A design can satisfy a cost constraint while performing poorly on habitat or maintenance criteria. Uncertainty concerns what is not known about outcomes or assumptions; it should be presented with scenarios, evidence gaps and a monitoring plan rather than hidden behind one exact score. Discuss who bears costs and benefits. Choosing among feasible designs includes values as well as ecological evidence, and revision remains part of responsible evaluation.
Read the visual model
Identify the labeled structures and units, then trace the arrows or compare values under the caption’s stated conditions. Separate the displayed evidence from a further inference. Write your reasoning before opening the guidance.
Does the cheapest feasible design automatically best meet the biological objective?
Visual reasoning — after your attempt
No. Compare effectiveness, durability, access, uncertainties and the stated priorities under the constraints.
Plans have costs — purchase, management, monitoring, and foregone human use — and those costs fall on particular people, often not the ones who gain the benefit. Comparing plans therefore means comparing expected outcomes against total costs over time, not comparing area or price alone. Cost per hectare is a particularly weak measure, since hectares differ enormously in what they contribute.
Expected outcomes are uncertain, and the honest presentation gives a range rather than a single figure, with the reasons for the uncertainty. Evidence can establish what each option is likely to produce and how confidently; it cannot settle how much present cost is worth bearing for a future benefit, which is a judgement for the people affected. A good analysis makes the choice visible instead of burying it in a recommendation.
Pause and explain
What should an analysis present when the expected outcome of a plan is uncertain?
Check your reasoning after answering
A range of plausible outcomes with the reasons for the uncertainty, rather than a single number, together with what would reduce that uncertainty. The decision then rests on explicit information rather than on false precision.
Apply the whole unit · Choose between two reserve plans
Illustrative proposals for one landscape, for a bird needing interior forest with a minimum breeding territory of 12 hectares. Plan A: one compact block of 900 ha, estimated 160 ha of edge-affected habitat, no corridor needed, purchase 450,000 dollars, annual management 28,000 dollars. Plan B: four separate blocks totalling 1,400 ha, estimated 520 ha of edge-affected habitat, corridors costing 120,000 dollars to establish, purchase 980,000 dollars, annual management 61,000 dollars. A single wildfire in this landscape typically burns 300 to 700 ha.
Your task
Calculate the interior habitat each plan provides and the number of territories each could support, calculate each plan's cost per hectare of interior habitat including corridors, state which plan you would recommend for this species and why, and explain how the wildfire information affects the comparison. Then state the uncertainty that most affects your recommendation.
What your response should show
- Choose the appropriate biological model or relationship and state the conditions it assumes.
- Show the counts, rates, ratios, or intermediate reasoning the question requires.
- Use the supplied evidence to justify the conclusion and separate observation from inference.
- Identify a meaningful limitation, uncertainty, or next measurement.
Response guidance — after your attempt
Plan A interior: 900 − 160 = 740 ha; territories = 740 / 12 ≈ 61.
Plan B interior: 1,400 − 520 = 880 ha; territories = 880 / 12 ≈ 73.
Plan A cost: 450,000 purchase, so 450,000 / 740 ≈ 608 dollars per hectare of interior habitat, plus 28,000 a year.
Plan B cost: 980,000 + 120,000 corridors = 1,100,000, so 1,100,000 / 880 = 1,250 dollars per hectare of interior habitat, plus 61,000 a year.
Compare: B provides about 20 percent more interior habitat and territories at roughly twice the cost per interior hectare and more than twice the annual management.
Apply the fire information: a typical fire of 300 to 700 ha could affect most of Plan A's single block at once, whereas Plan B's four separate blocks make simultaneous loss unlikely, so B spreads catastrophic risk.
Recommend with the reasoning explicit: for a species needing interior forest, B's larger interior area and lower catastrophic risk favour it if the budget allows, while A is markedly more cost-effective per interior hectare if it does not.
Name the key uncertainty: the edge-affected estimates, since a modest error in how far edge effects penetrate changes the interior figures and could reverse the comparison.
Plan A provides 740 hectares of interior habitat, about 61 territories, at roughly 608 dollars per interior hectare plus 28,000 a year. Plan B provides 880 hectares and about 73 territories, but at 1,250 dollars per interior hectare once corridors are included, plus 61,000 a year — roughly twice the cost per interior hectare for about 20 percent more habitat. The wildfire information matters more than the cost difference: a typical 300 to 700 hectare fire could burn most of Plan A's single 900-hectare block at once, while four separated blocks are unlikely to be lost simultaneously, so Plan B protects against the loss that would end the population outright. On that basis I would recommend Plan B where the budget permits, and Plan A where it does not, stating plainly that the choice turns on how much weight is given to catastrophic risk against cost. The estimates of edge-affected habitat are the largest uncertainty: they are modelled rather than measured, and if edge effects penetrate further than assumed, both interior figures fall and Plan B's advantage in interior area could disappear. Measuring edge penetration directly in existing forest patches would be the first thing to do before committing.
Scientific references and adapted source figures
- OpenSciEd 7.5 — ecosystem dynamics and public case graphs
- OpenSciEd middle-school source license — CC BY 4.0
Parent / teacher teaching notes
This unit is where the course's reasoning habits are applied to a decision, so judge the answer by whether the objective, the evidence, the uncertainty, and the cost-bearer are all named — not by which plan is chosen. The cost-per-interior-hectare calculation is the one worth insisting on, because cost per hectare of land is the figure usually quoted and it is the wrong denominator. Keep the recommendation and the value judgement visibly separate: evidence shows what each plan is likely to deliver, and how much present cost is worth bearing is not a scientific question. Ask for an explanation of each label, arrow and axis before calculation. Keep first and revised models; attempt the changed case before consulting guidance. Distinguish invented instructional records from named historical sources. Source chromosome symbols are allele-category models, not DNA sequences. These independently authored high-school supplements are not the full OpenSciEd teacher editions or an endorsement.
The key idea
Comparable sampling and explicit goals make biodiversity evidence useful for evaluating a conservation design.
Worked examples
Example 1
- Richness is four in both samples.
- A distributes individuals equally; B is dominated by one species.
Example 2 · Worked application
- Sampling effort differs.
- More effort can detect additional species even at the same true richness.
- Standardize or account for effort and detection.
Observed count is not automatically total species present.
Example 3
- Sampling effort differs and rare species need time to detect.
- Use comparable effort or a method that accounts for detection before ranking.
Example 4 · Find and fix the mistake
- Test the claim against the stated conditions: Observed count is not automatically total species present.
- Limited sampling and imperfect detection can miss present species.
Observed count is not automatically total species present.
Example 5 · Reason from the visual evidence
- A monitoring criterion states what result would support progress, reveal failure or trigger revision. Reference sites help distinguish intervention effects from broader changes, though they need comparable conditions and sampling. A before–after difference can be misleading when weather, detection or other pressures also change. Record methods, repeated observations and uncertainty before selecting favorable outcomes. A project’s activity count, such as materials installed, is not automatically evidence that the desired ecological mechanism occurred.
- This limits selecting only favorable measures afterward and makes the evaluation transparent and testable.
Original matched-monitoring illustration, not an estimate of a real restoration effect.
Avoid these mistakes
- A larger species count under greater sampling effort does not automatically prove a more diverse site.
Check your understanding
Site A yields 12 species in 1 h; B yields 18 in 4 h. Can you confidently rank their richness?
Discuss the answer
No confident ranking follows from these counts alone.
Why must a conservation intervention match the particular threat being measured?
Discuss the answer
An intervention must affect the actual limiting pressure or process. A corridor, harvest limit and nutrient-control design address different mechanisms and need matched outcome evidence.
Return to the phenomenon
Return to the initial case. How can equal-area designs have different conservation outcomes? Revise your drawing or explanation using two named ideas and one stated limitation.
Compare explanations after your attempt
Evidence tests a design’s mechanism and limits; area, cost or one favorable observation alone does not decide all outcomes.
What should we investigate next?
Which comparison would test a remaining uncertainty? State what you would change, keep comparable and measure.
Investigate, explain and revise
Complete these tasks after the teaching parts. Preserve your first model and a supported revision; use guidance after a real attempt.
Activity 1 · Return to the opening case
Use the opening question, defined terms, Parts 1–4 and your notebook. The supplied-data route needs no equipment or external account.
Your task
Return to the initial case. How can equal-area designs have different conservation outcomes? Revise your drawing or explanation using two named ideas and one stated limitation.
Success criteria
- Use relevant stated observations.
- Explain the mechanism with a labeled model.
- Distinguish quantities and assumptions.
- Describe a revision and a useful next test.
Hint
Follow objects, materials and information separately. Check what each measured quantity means.
Response guidance — discuss after your attempt
Evidence tests a design’s mechanism and limits; area, cost or one favorable observation alone does not decide all outcomes.
Activity 2 · Transfer to a changed case
Cover the worked guidance and use the unit explanations/figures to solve a changed problem.
Your task
Two equal-area reserves have dimensions 100×100 m and 200×50 m. Find their perimeters and explain why shape alone cannot select the best design.
Success criteria
- Use the stated measurements or conditions, with correct units.
- Connect the result to the biological mechanism or evidence relationship.
- Identify the assumption, model limit or further evidence requested.
Hint
Name the stated conditions, select the relevant mechanism and show intermediate reasoning.
Response guidance — discuss after your attempt
Their areas are 10,000 m² and perimeters 400 versus 500 m. Boundary exposure and width differ, but species, habitat quality, connectivity, disturbance, costs and goals determine the useful comparison.
Words to know
- species richness
- The number of species recorded in a defined sample.
- evenness
- How equally abundance is distributed across sampled species.
- constraint
- A limit a proposed design must satisfy.
In the real world
Exit check
State one conservation goal and a matching measurement.
Check your explanation after answering
For example, maintain native species richness under standardized surveys over several years, while also tracking abundance and habitat condition.
Explain your reasoning without notes. If a key idea is missing, revisit the lesson and try again.
Problem 1
Answer and explanation
3 species
Only three have nonzero observed counts.
Problem 2
- Comparable untreated sites and consistent sampling
- Changing methods every visit
- Only an expected result
- Removing all uncertainty statements
Answer and explanation
Comparable untreated sites and consistent sampling
Comparison sites help account for other changes.
Problem 3
Answer and explanation
It may fail important outcomes or impose other costs; compare criteria and constraints.
Problem 4
Answer and explanation
No confident ranking follows from these counts alone.
Sampling effort differs and rare species need time to detect.
Use comparable effort or a method that accounts for detection before ranking.
Response criteria
- Use the stated conditions.
- Show the evidence or calculation.
- Explain the conclusion and any stated limitation.
Problem 5
Hints
Observed count is not automatically total species present.
Answer and explanation
It improves comparability and helps distinguish real change from detection or timing effects.
Problem 6
Hints
State what the supplied observations or conditions establish, and separate that from any assumption.
Answer and explanation
Whether isolation is actually a limiting mechanism; the design must address the documented cause and measure relevant outcomes.
Problem 7
Answer and explanation
This limits selecting only favorable measures afterward and makes the evaluation transparent and testable.
A monitoring criterion states what result would support progress, reveal failure or trigger revision. Reference sites help distinguish intervention effects from broader changes, though they need comparable conditions and sampling. A before–after difference can be misleading when weather, detection or other pressures also change. Record methods, repeated observations and uncertainty before selecting favorable outcomes. A project’s activity count, such as materials installed, is not automatically evidence that the desired ecological mechanism occurred.
This limits selecting only favorable measures afterward and makes the evaluation transparent and testable.
Response criteria
- Read the structures, axes, directions and units correctly.
- Connect the evidence with the biological mechanism.
- Respect stated model assumptions and distinguish an observation from a further inference.
Problem 8
Answer and explanation
Their areas are 10,000 m² and perimeters 400 versus 500 m. Boundary exposure and width differ, but species, habitat quality, connectivity, disturbance, costs and goals determine the useful comparison.
Their areas are 10,000 m² and perimeters 400 versus 500 m. Boundary exposure and width differ, but species, habitat quality, connectivity, disturbance, costs and goals determine the useful comparison.
Response criteria
- Use the stated measurements or conditions, with correct units.
- Connect the result to the biological mechanism or evidence relationship.
- Identify the assumption, model limit or further evidence requested.